

‘making complex
data simple’
Infographics
Infographic design visually represents information and data in a clear, concise, and engaging way.
The look, feel and tone are determined by the audience. Some are playful and engaging, some are factual. Some are space efficient, others are dynamic. We understand the purpose of each and design with this in mind.
As designers who love typography (and numbers), creating infographics is an area SCENARIO particularly enjoys.

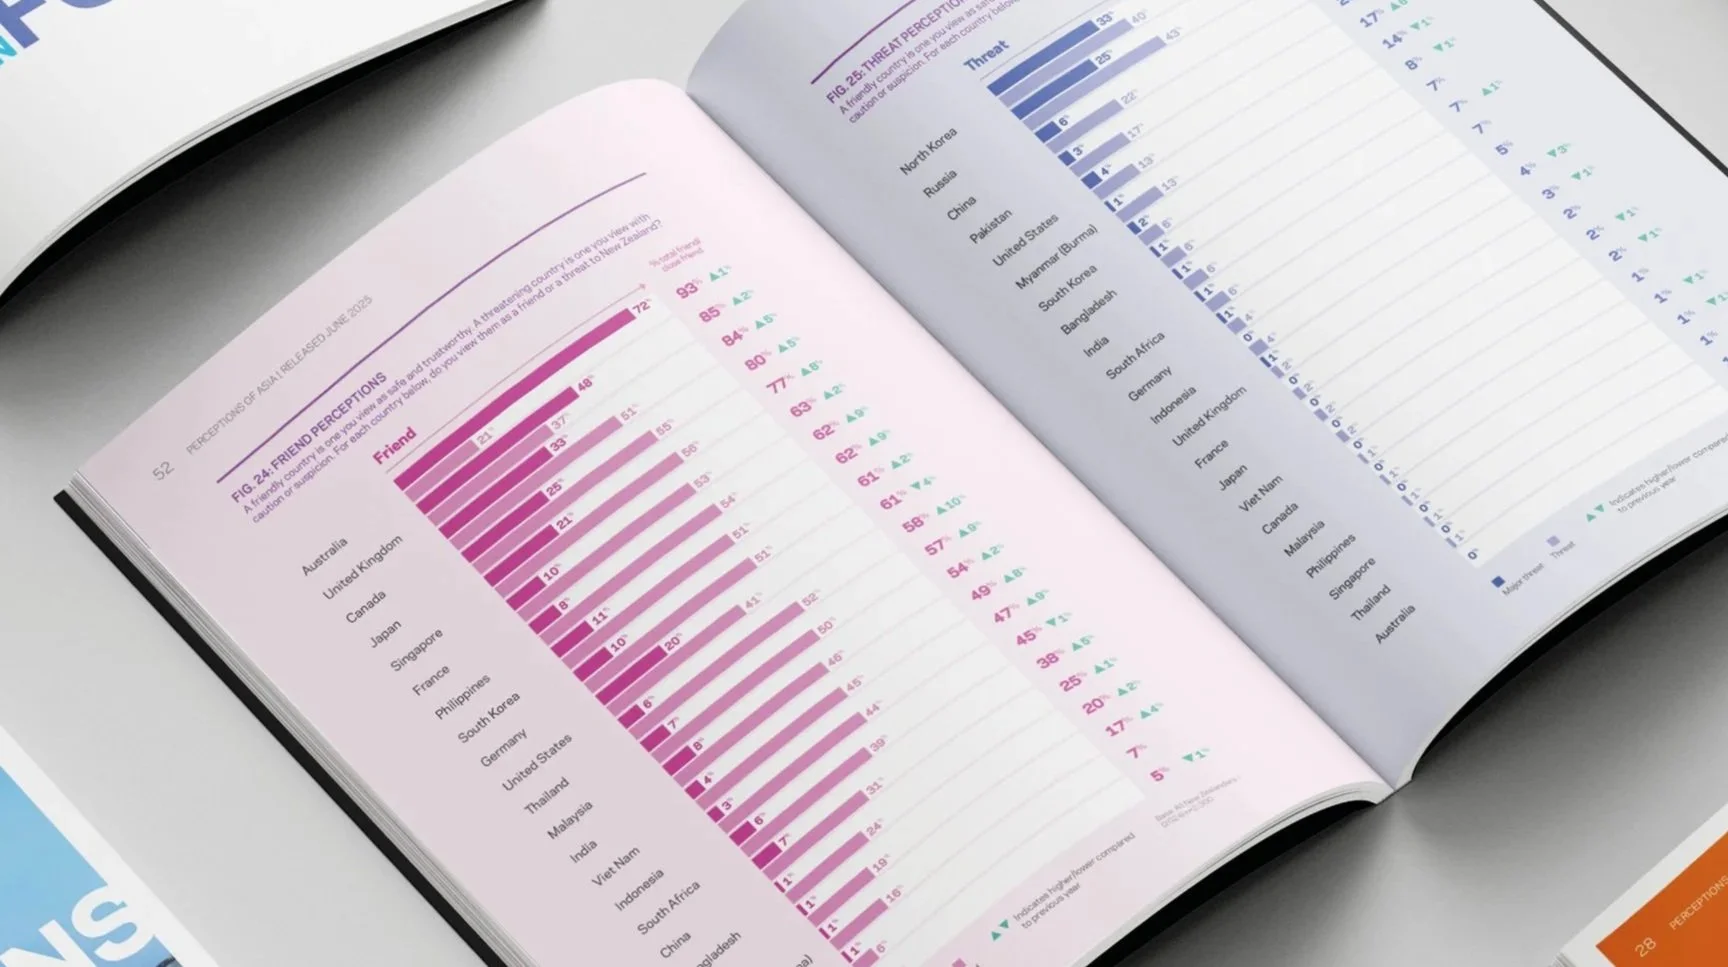
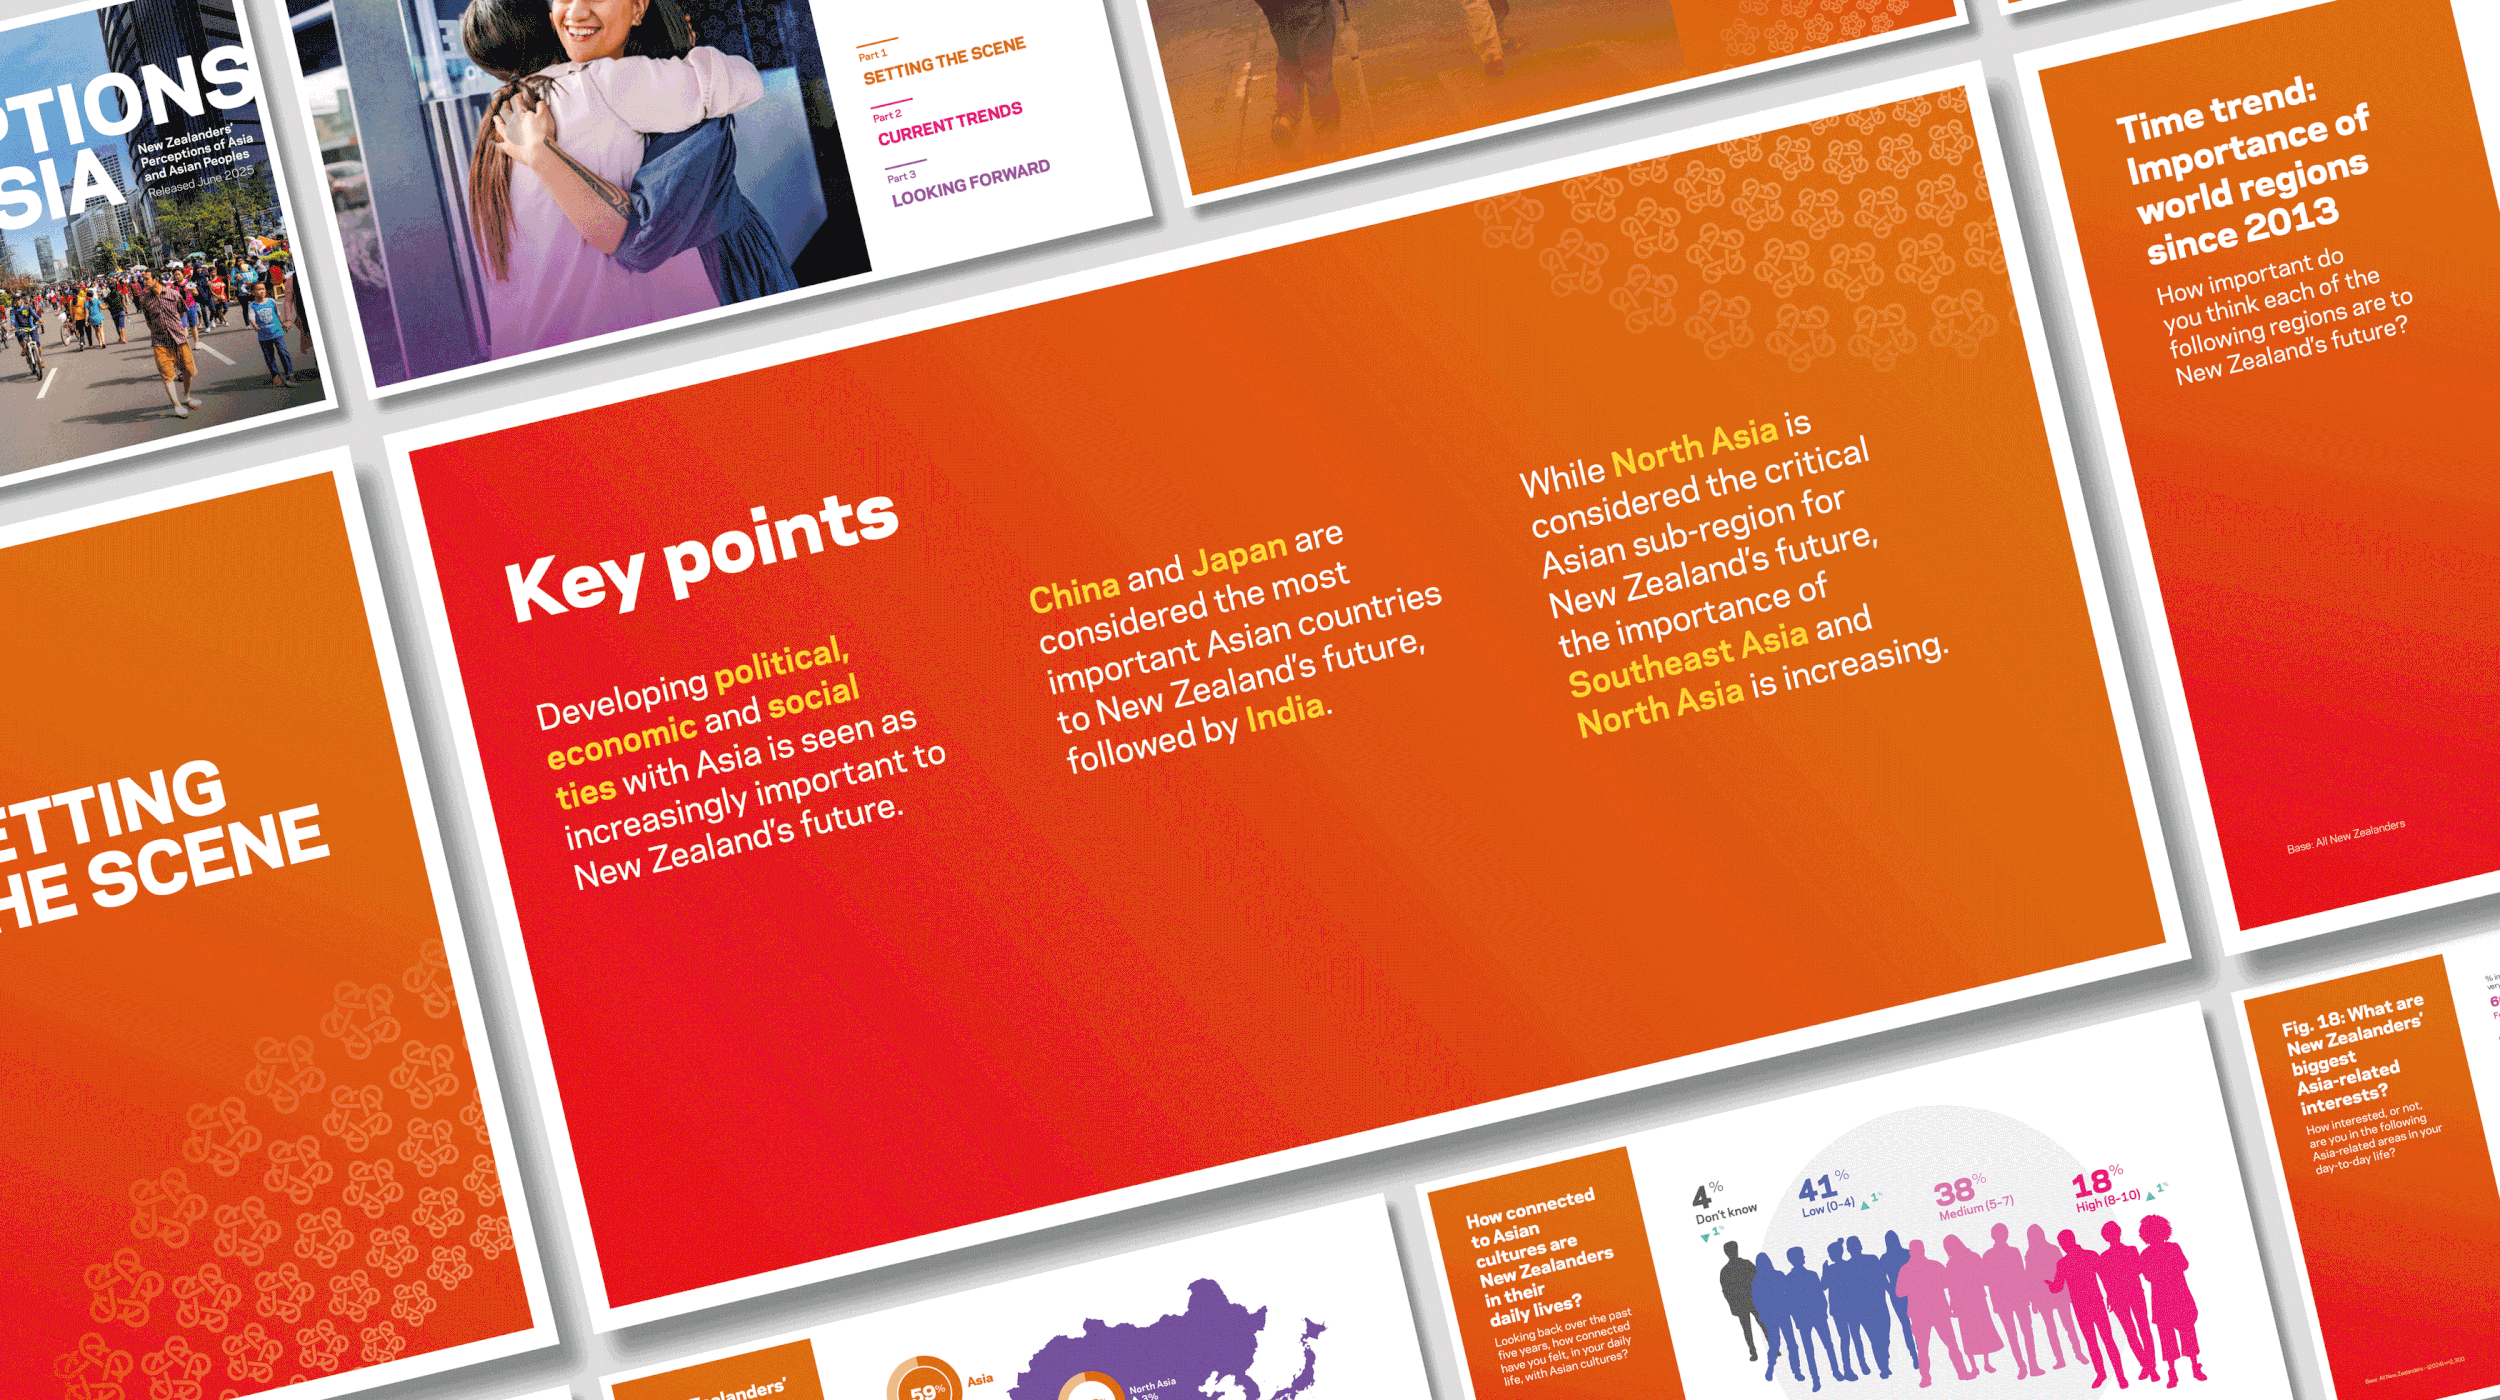

Perceptions of Asia
Asia New Zealand Foundation Te Whītau Tūhono
This report is the Foundation’s flagship longitudinal survey. Various digital items were created to support the printed full report. These ranged from social media tiles to digital ads, digital posters, email footers, interactive PDFs, and electronic PowerPoint templates.


Scientific website illustrations
GNS Science
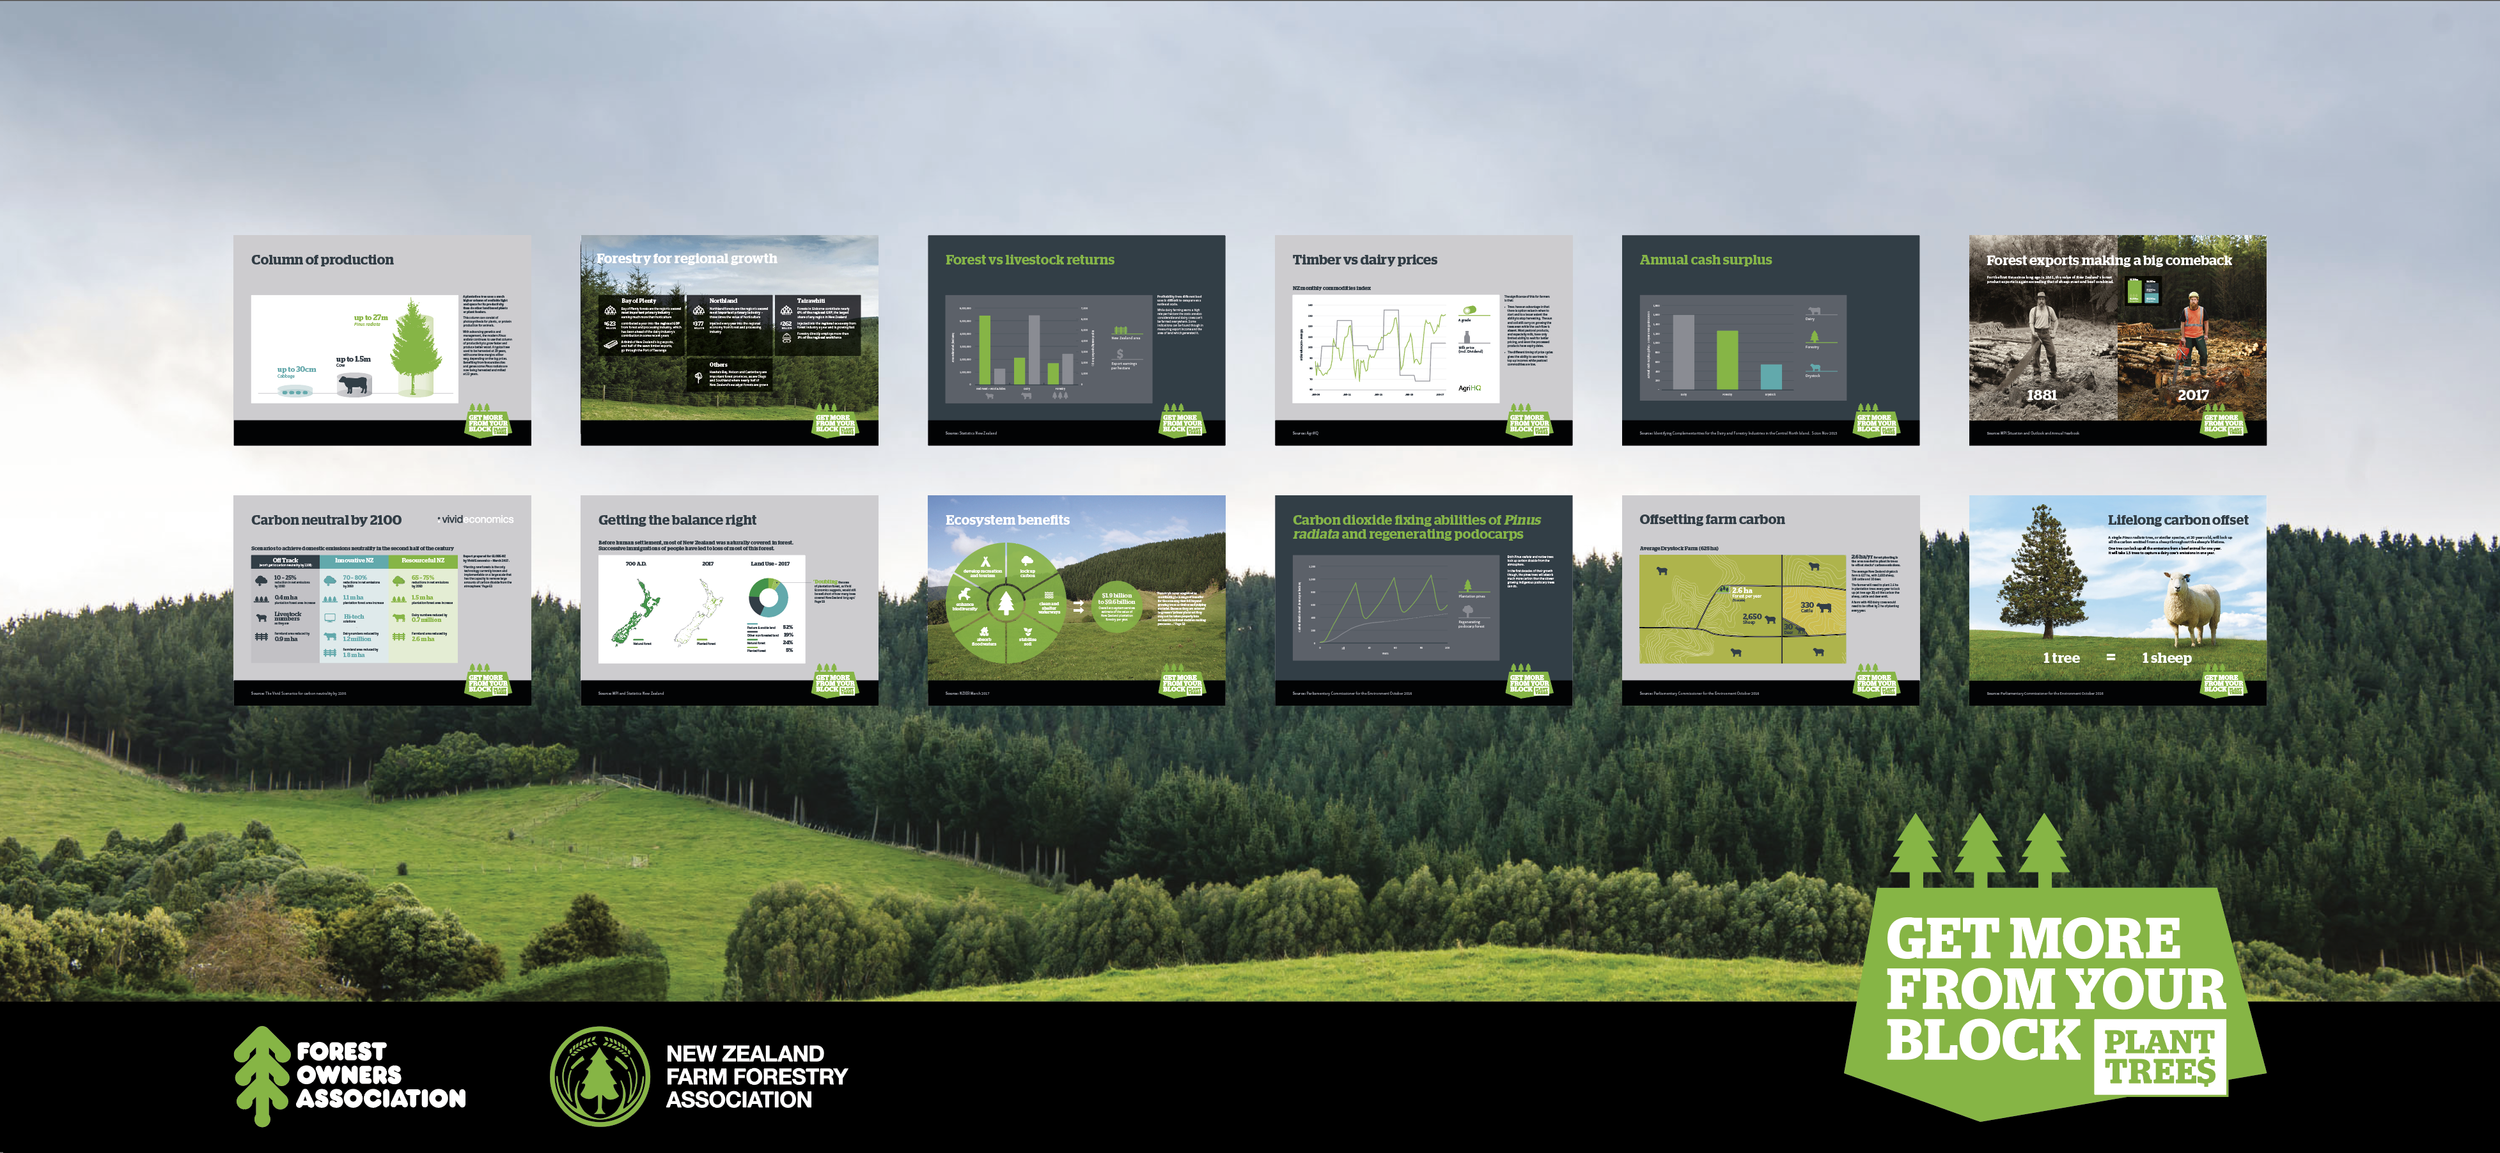
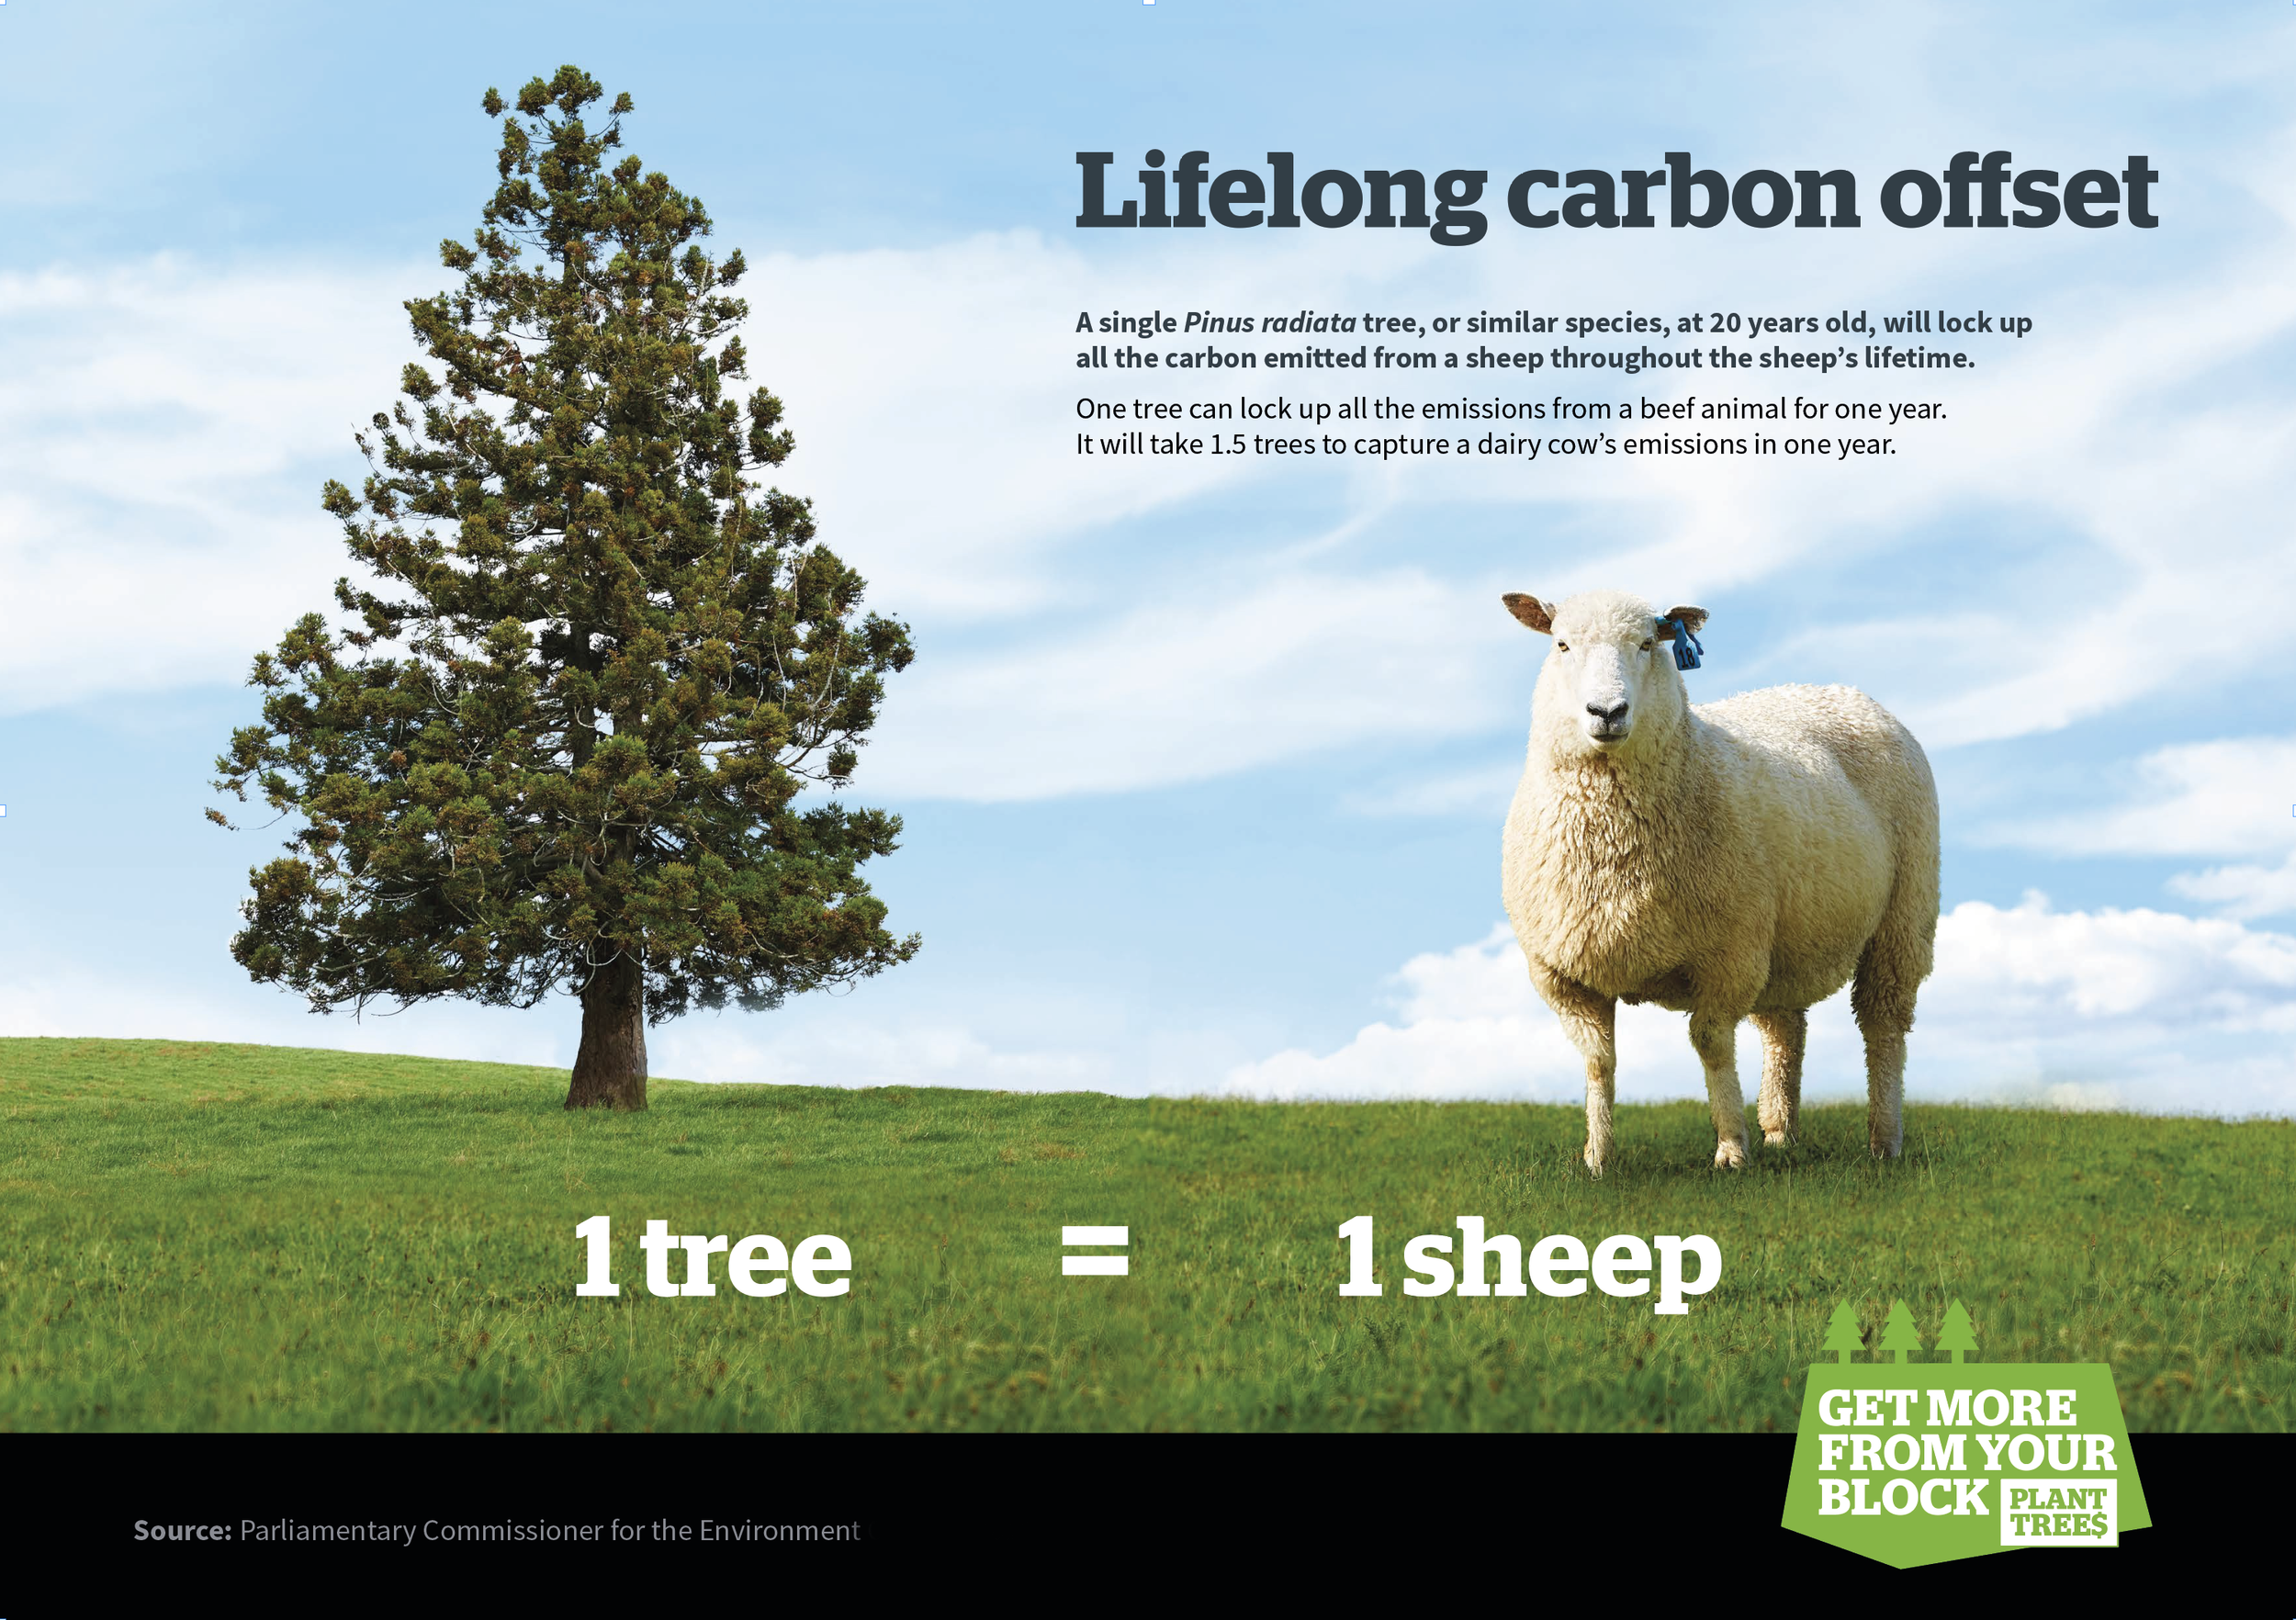
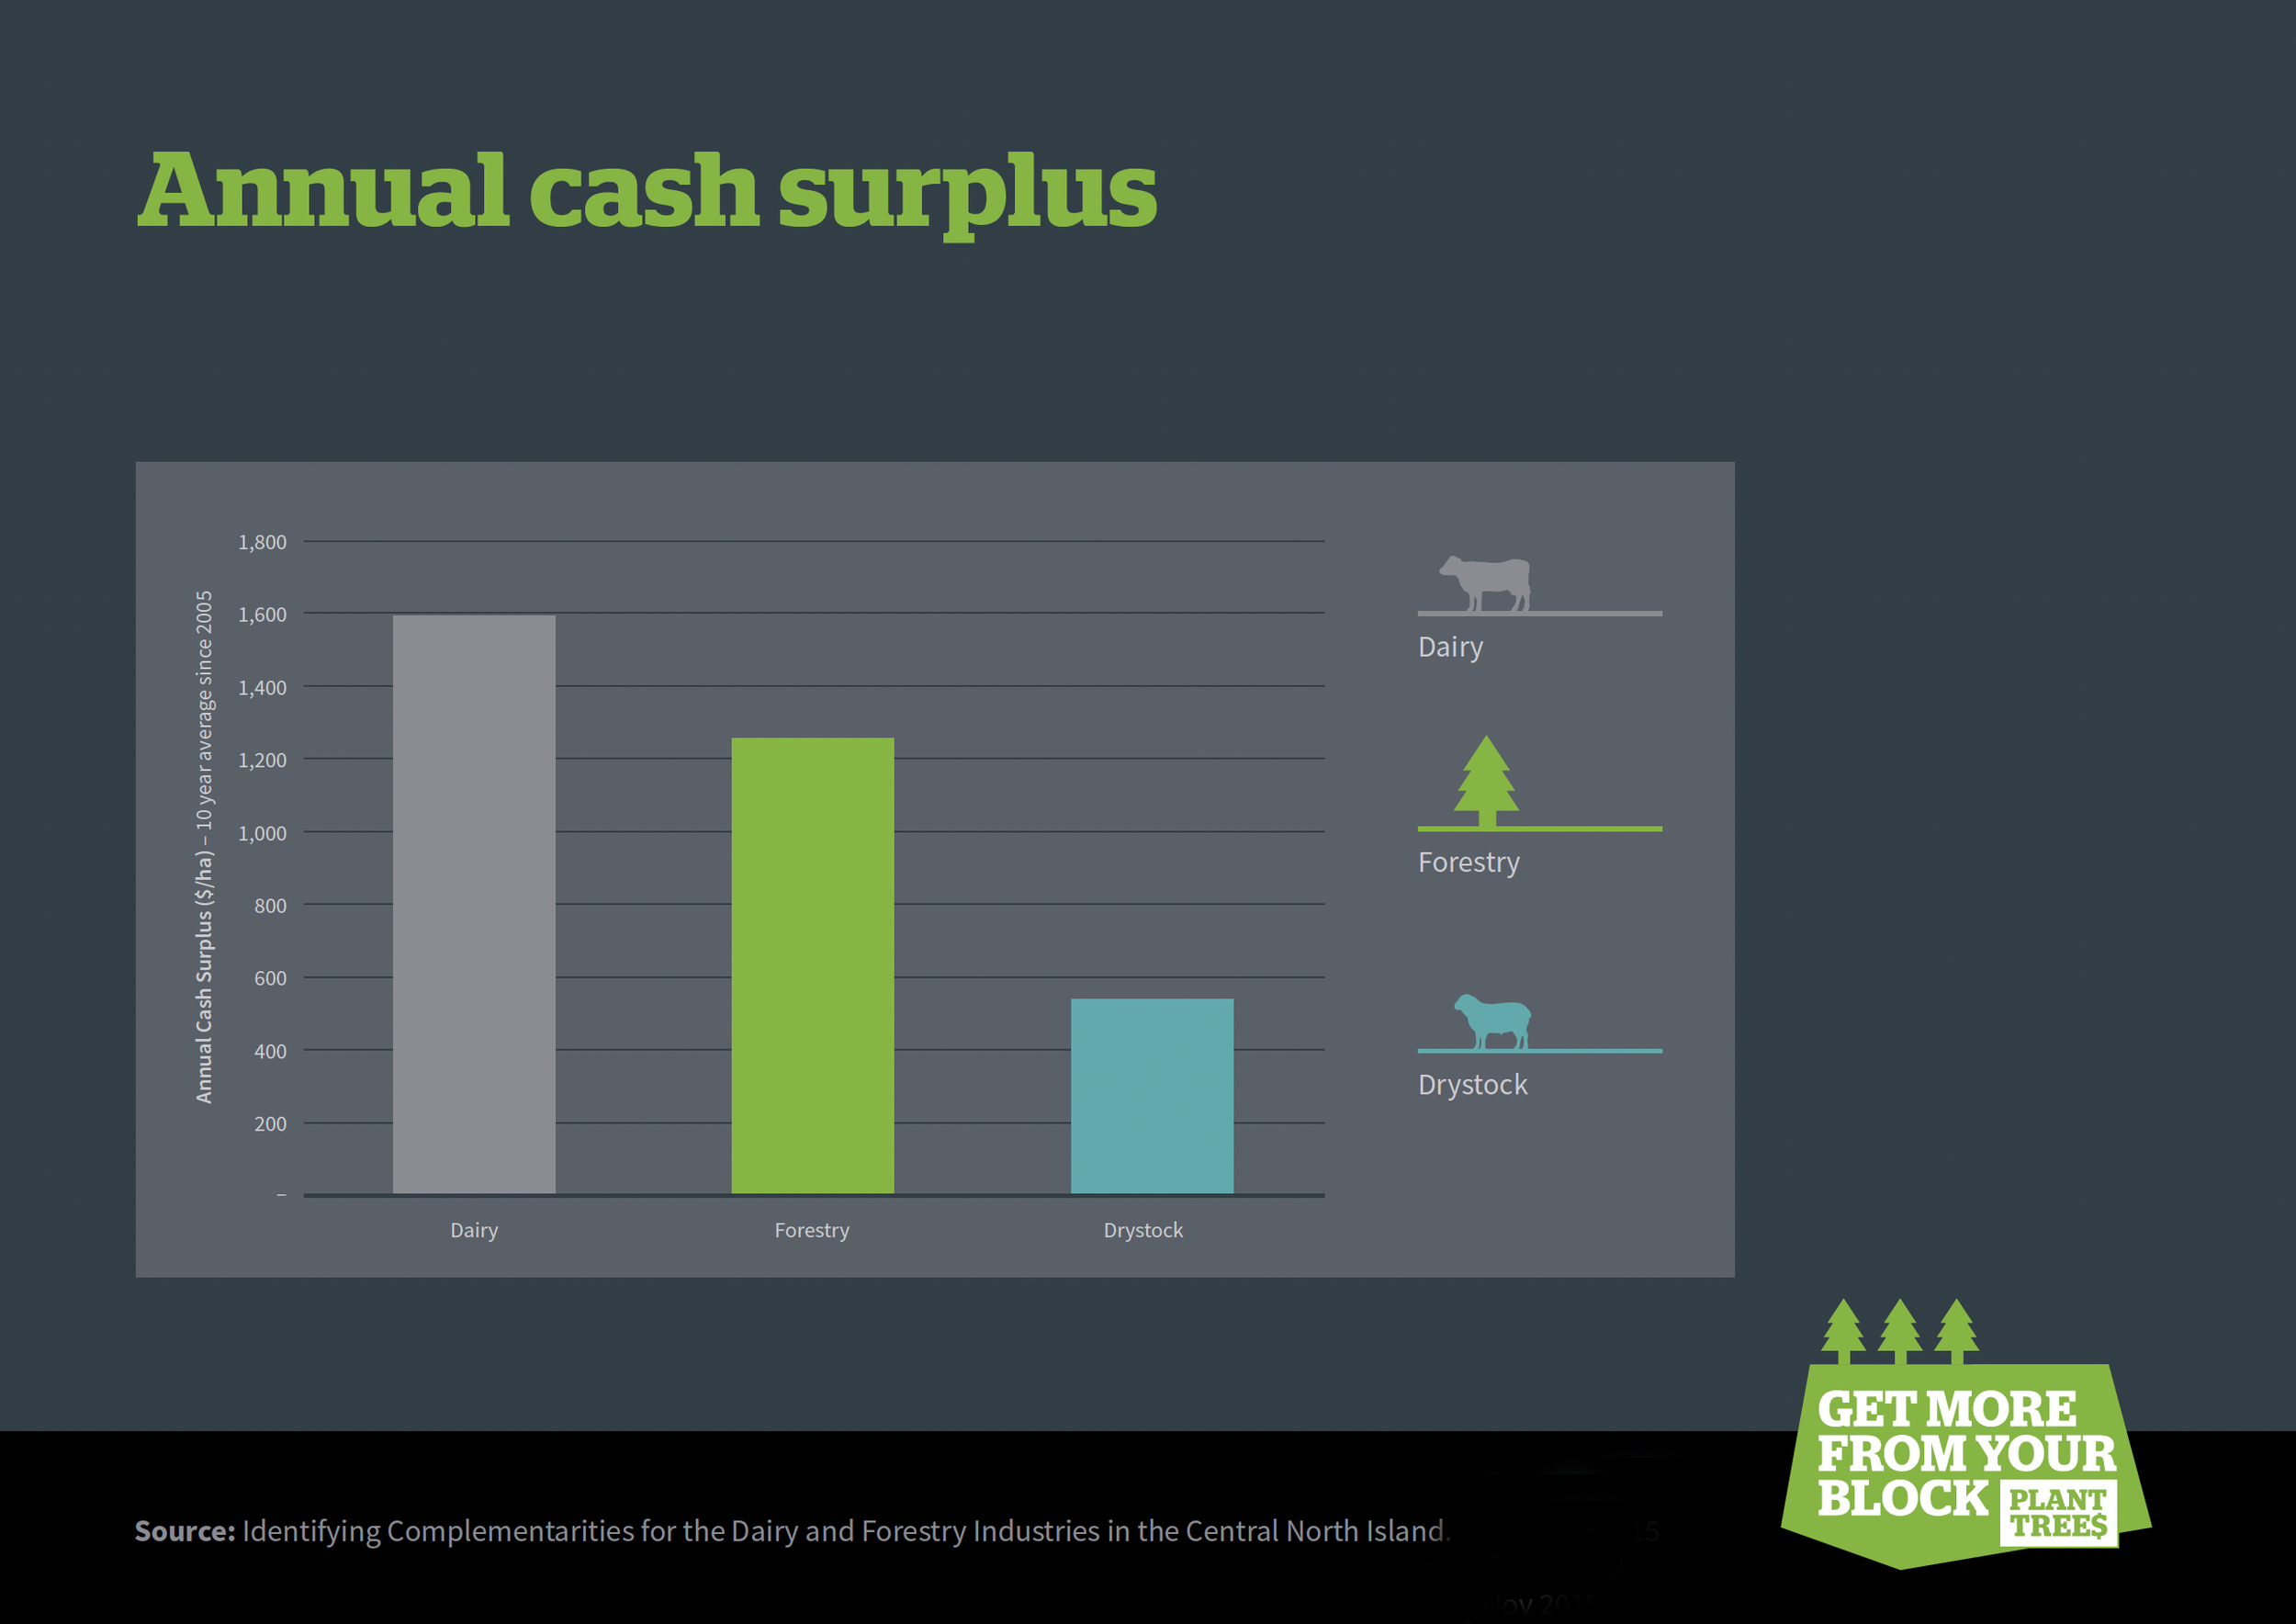
Campaign infographics
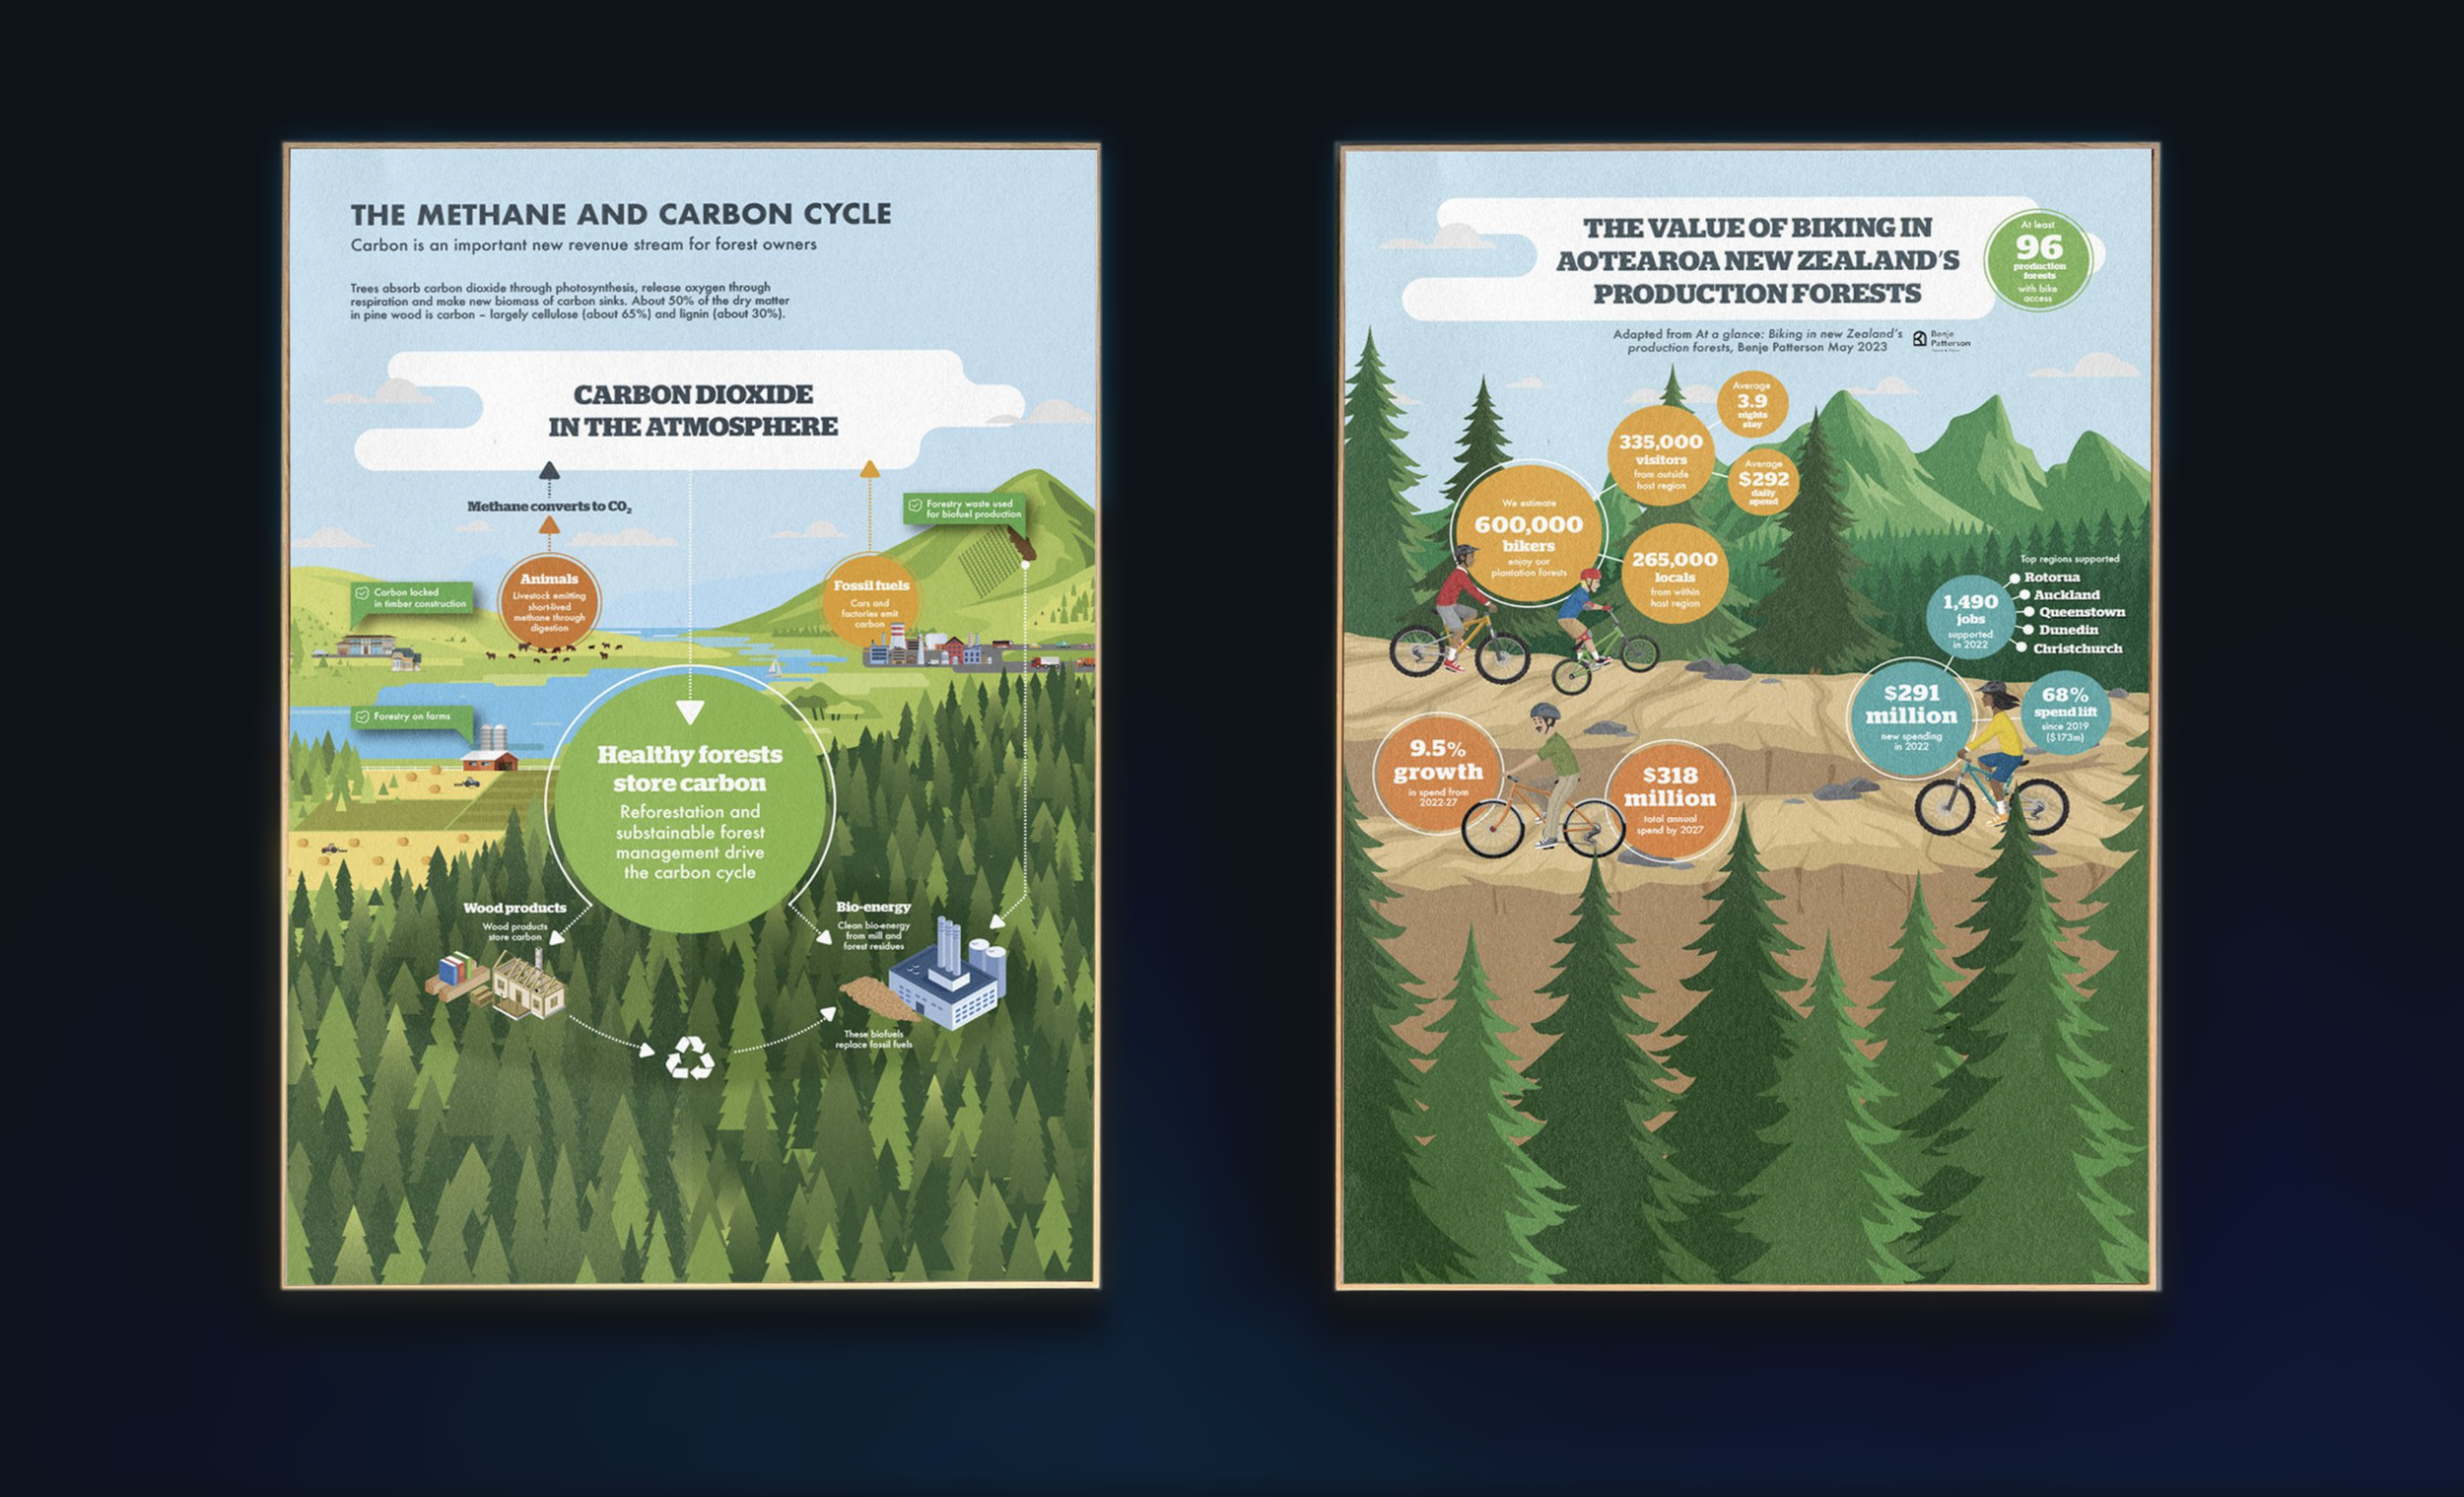
Forest Owners Association and New Zealand Farm Forestry Association


Technical diagrams and tailored icons
Ministry of Business, Innovation and Employment (MBIE)
Exhibition infographics
Forest Growers Levy Trust

Conceptual infographics
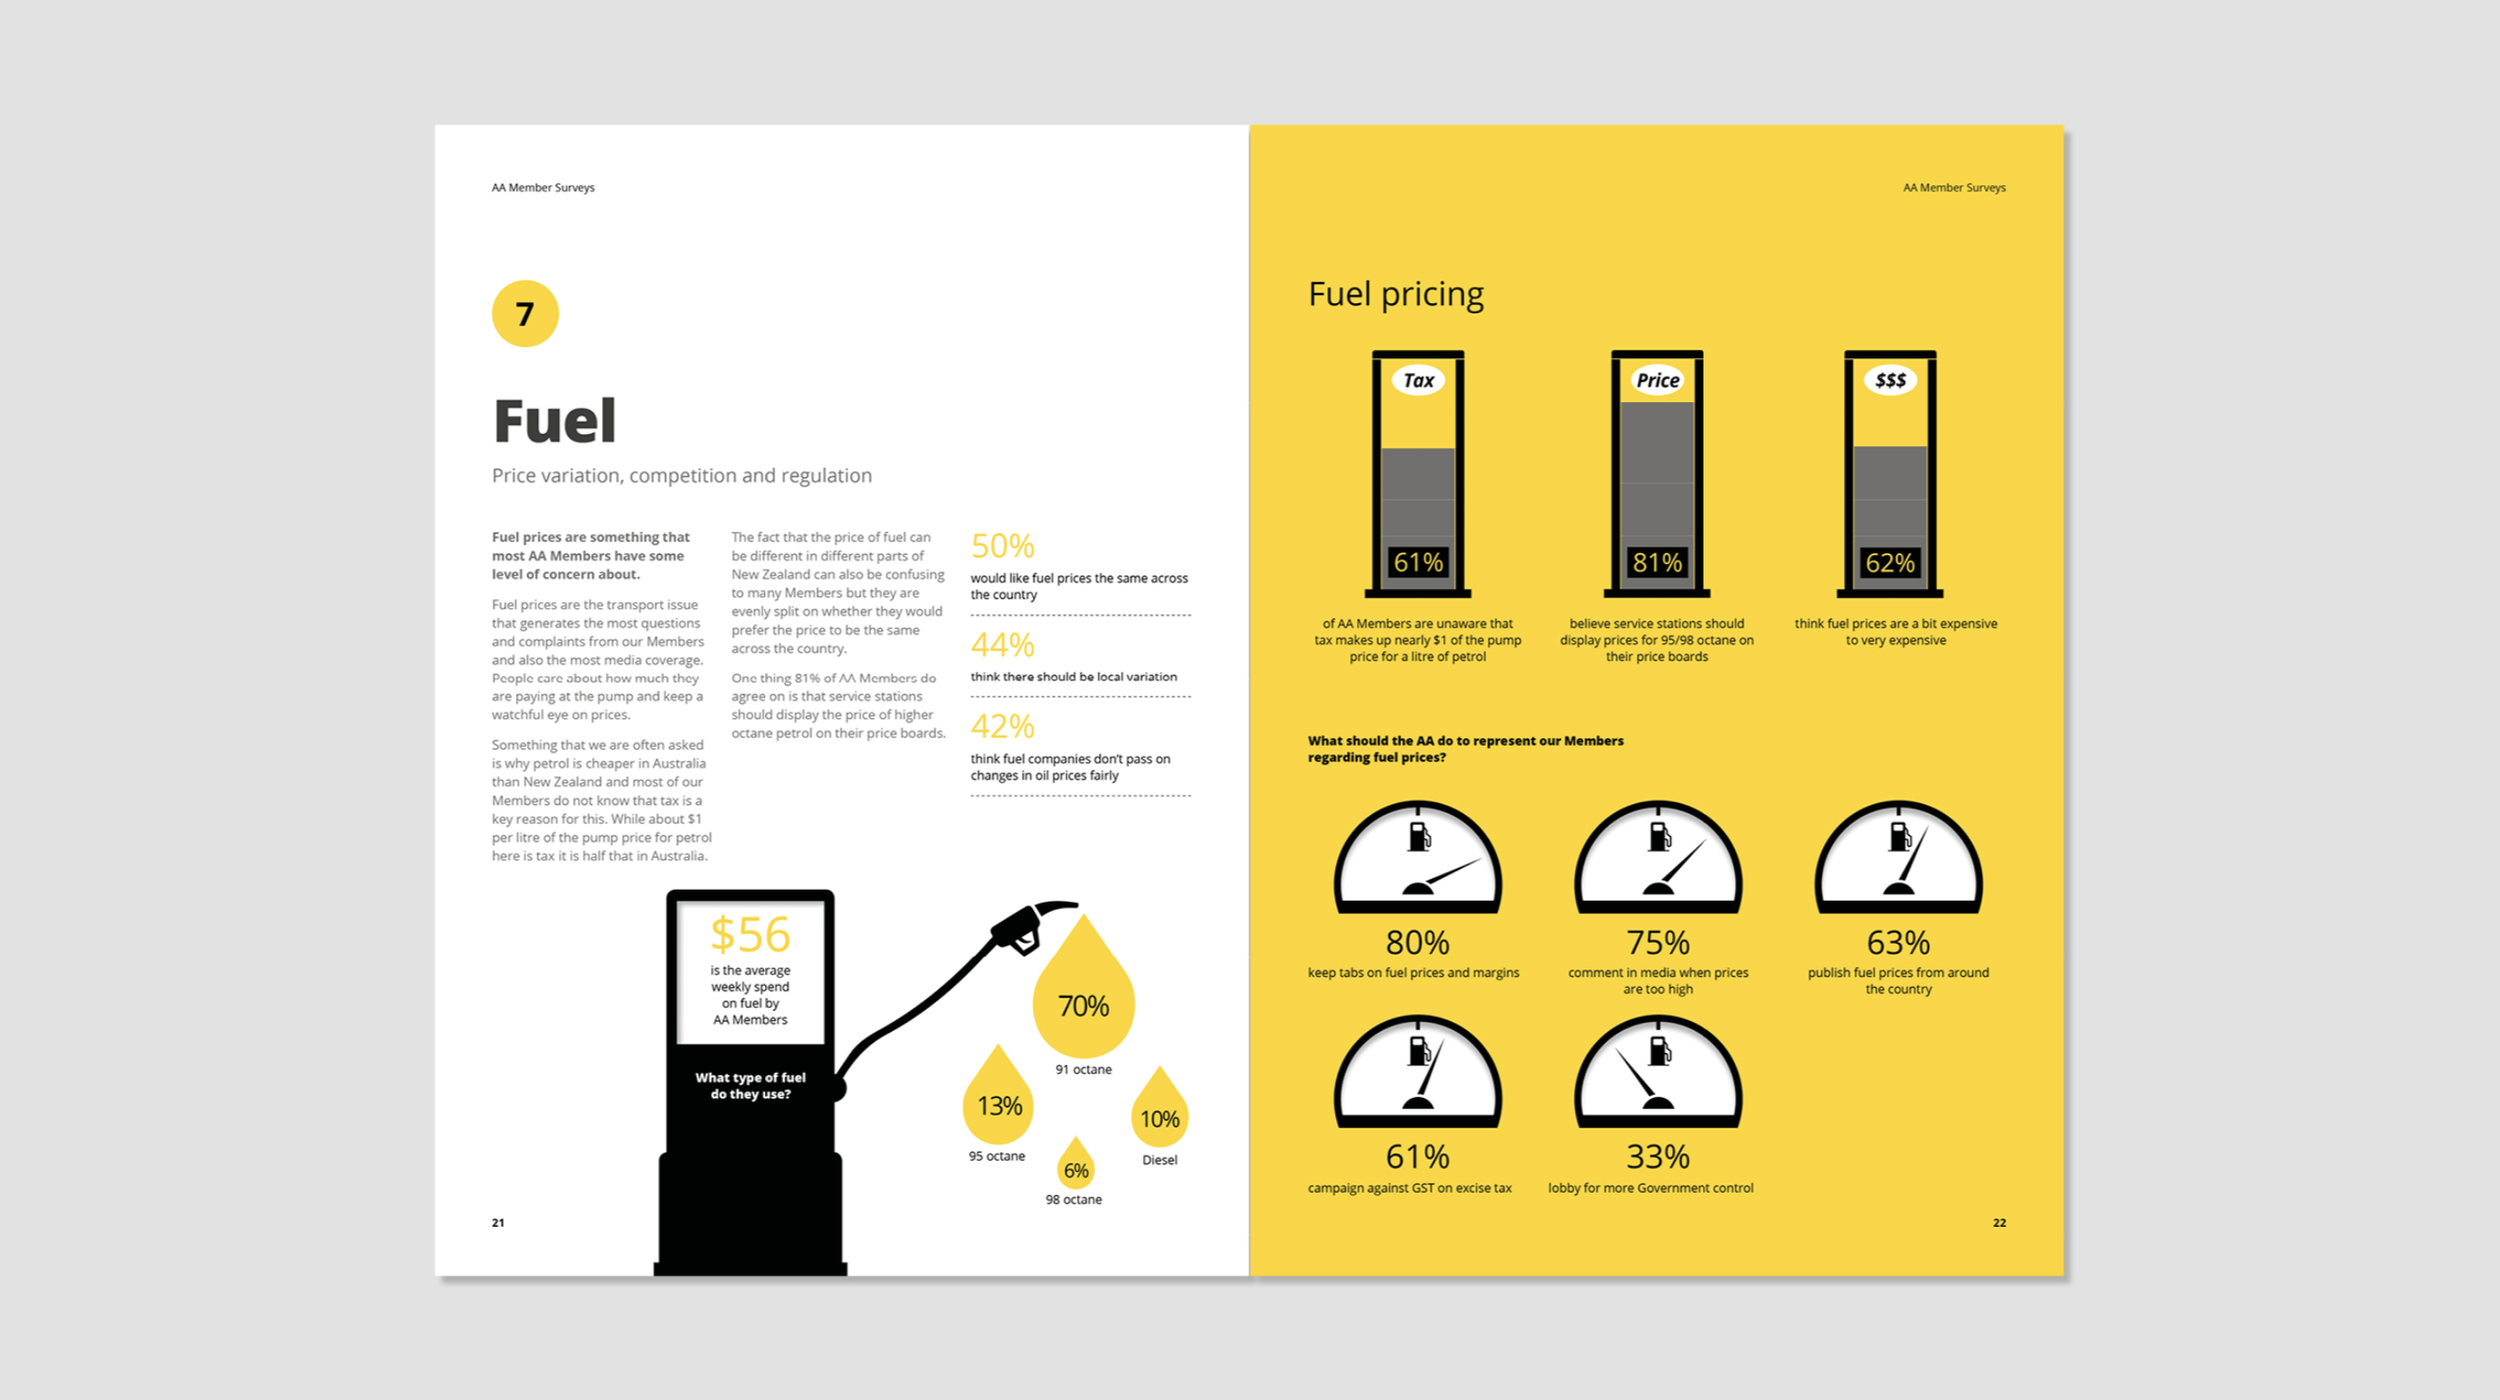
AA New Zealand


Infographics
Health New Zealand – Te Whatu Ora


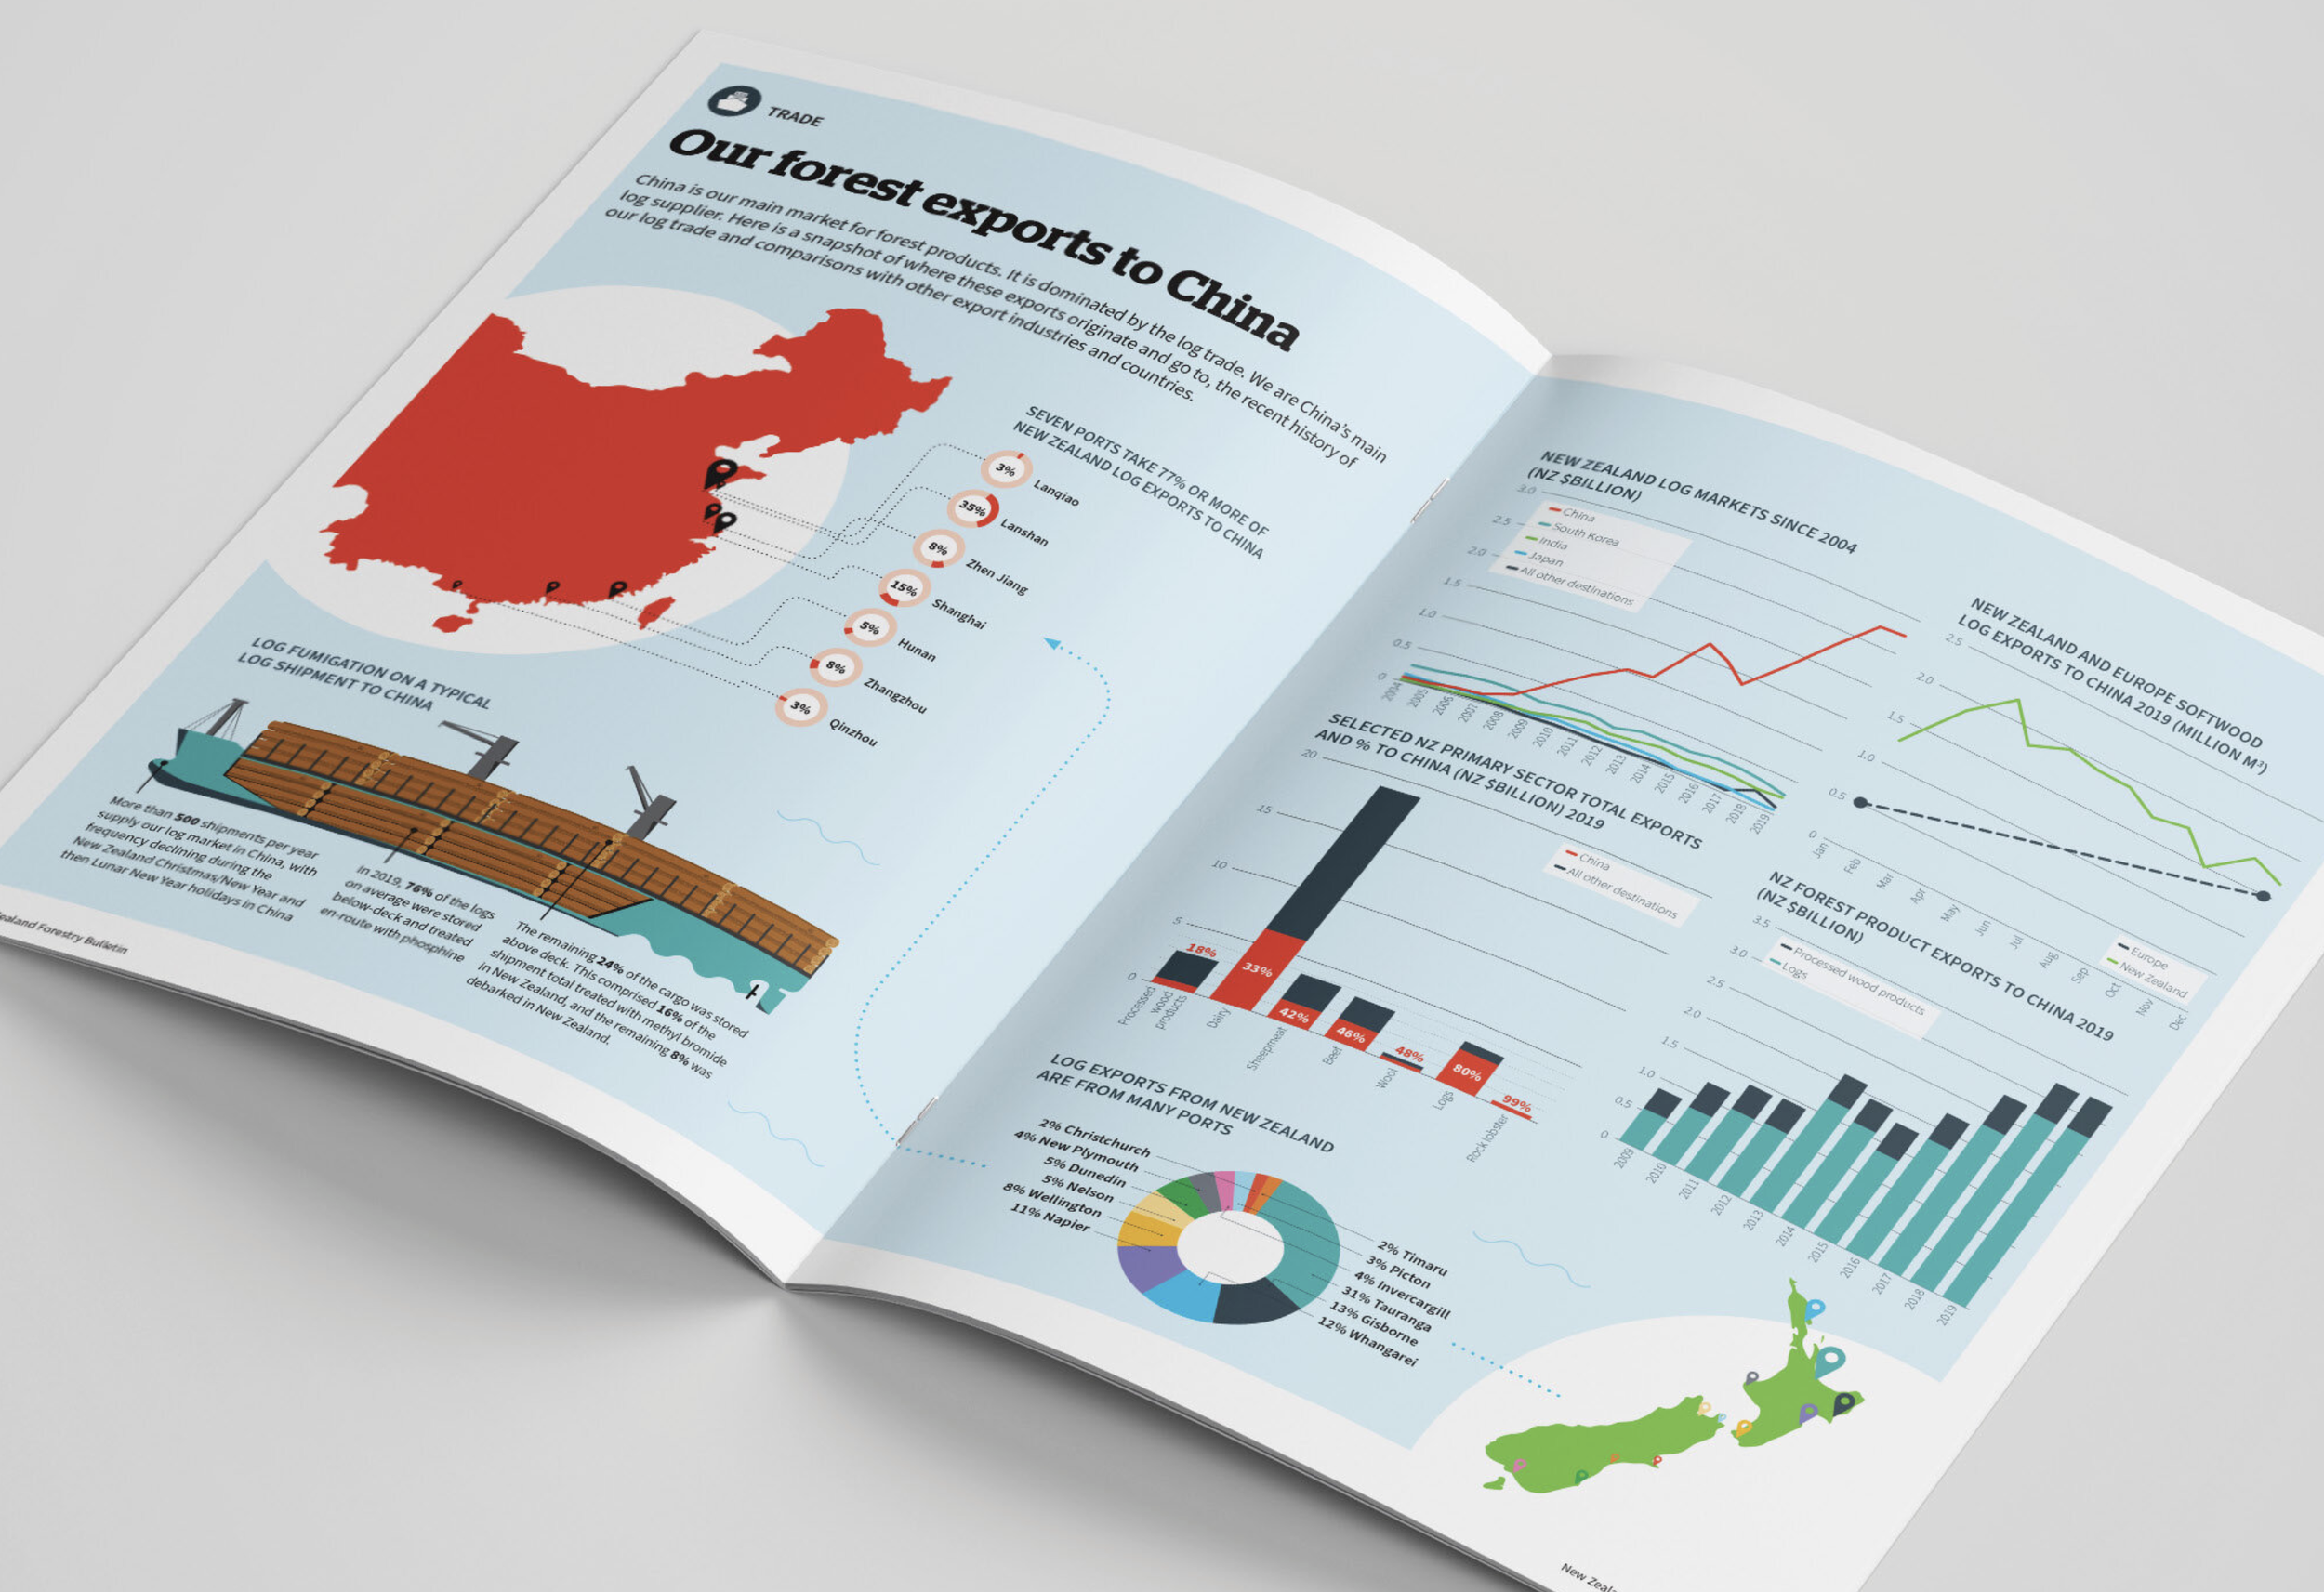
Yearly data updates
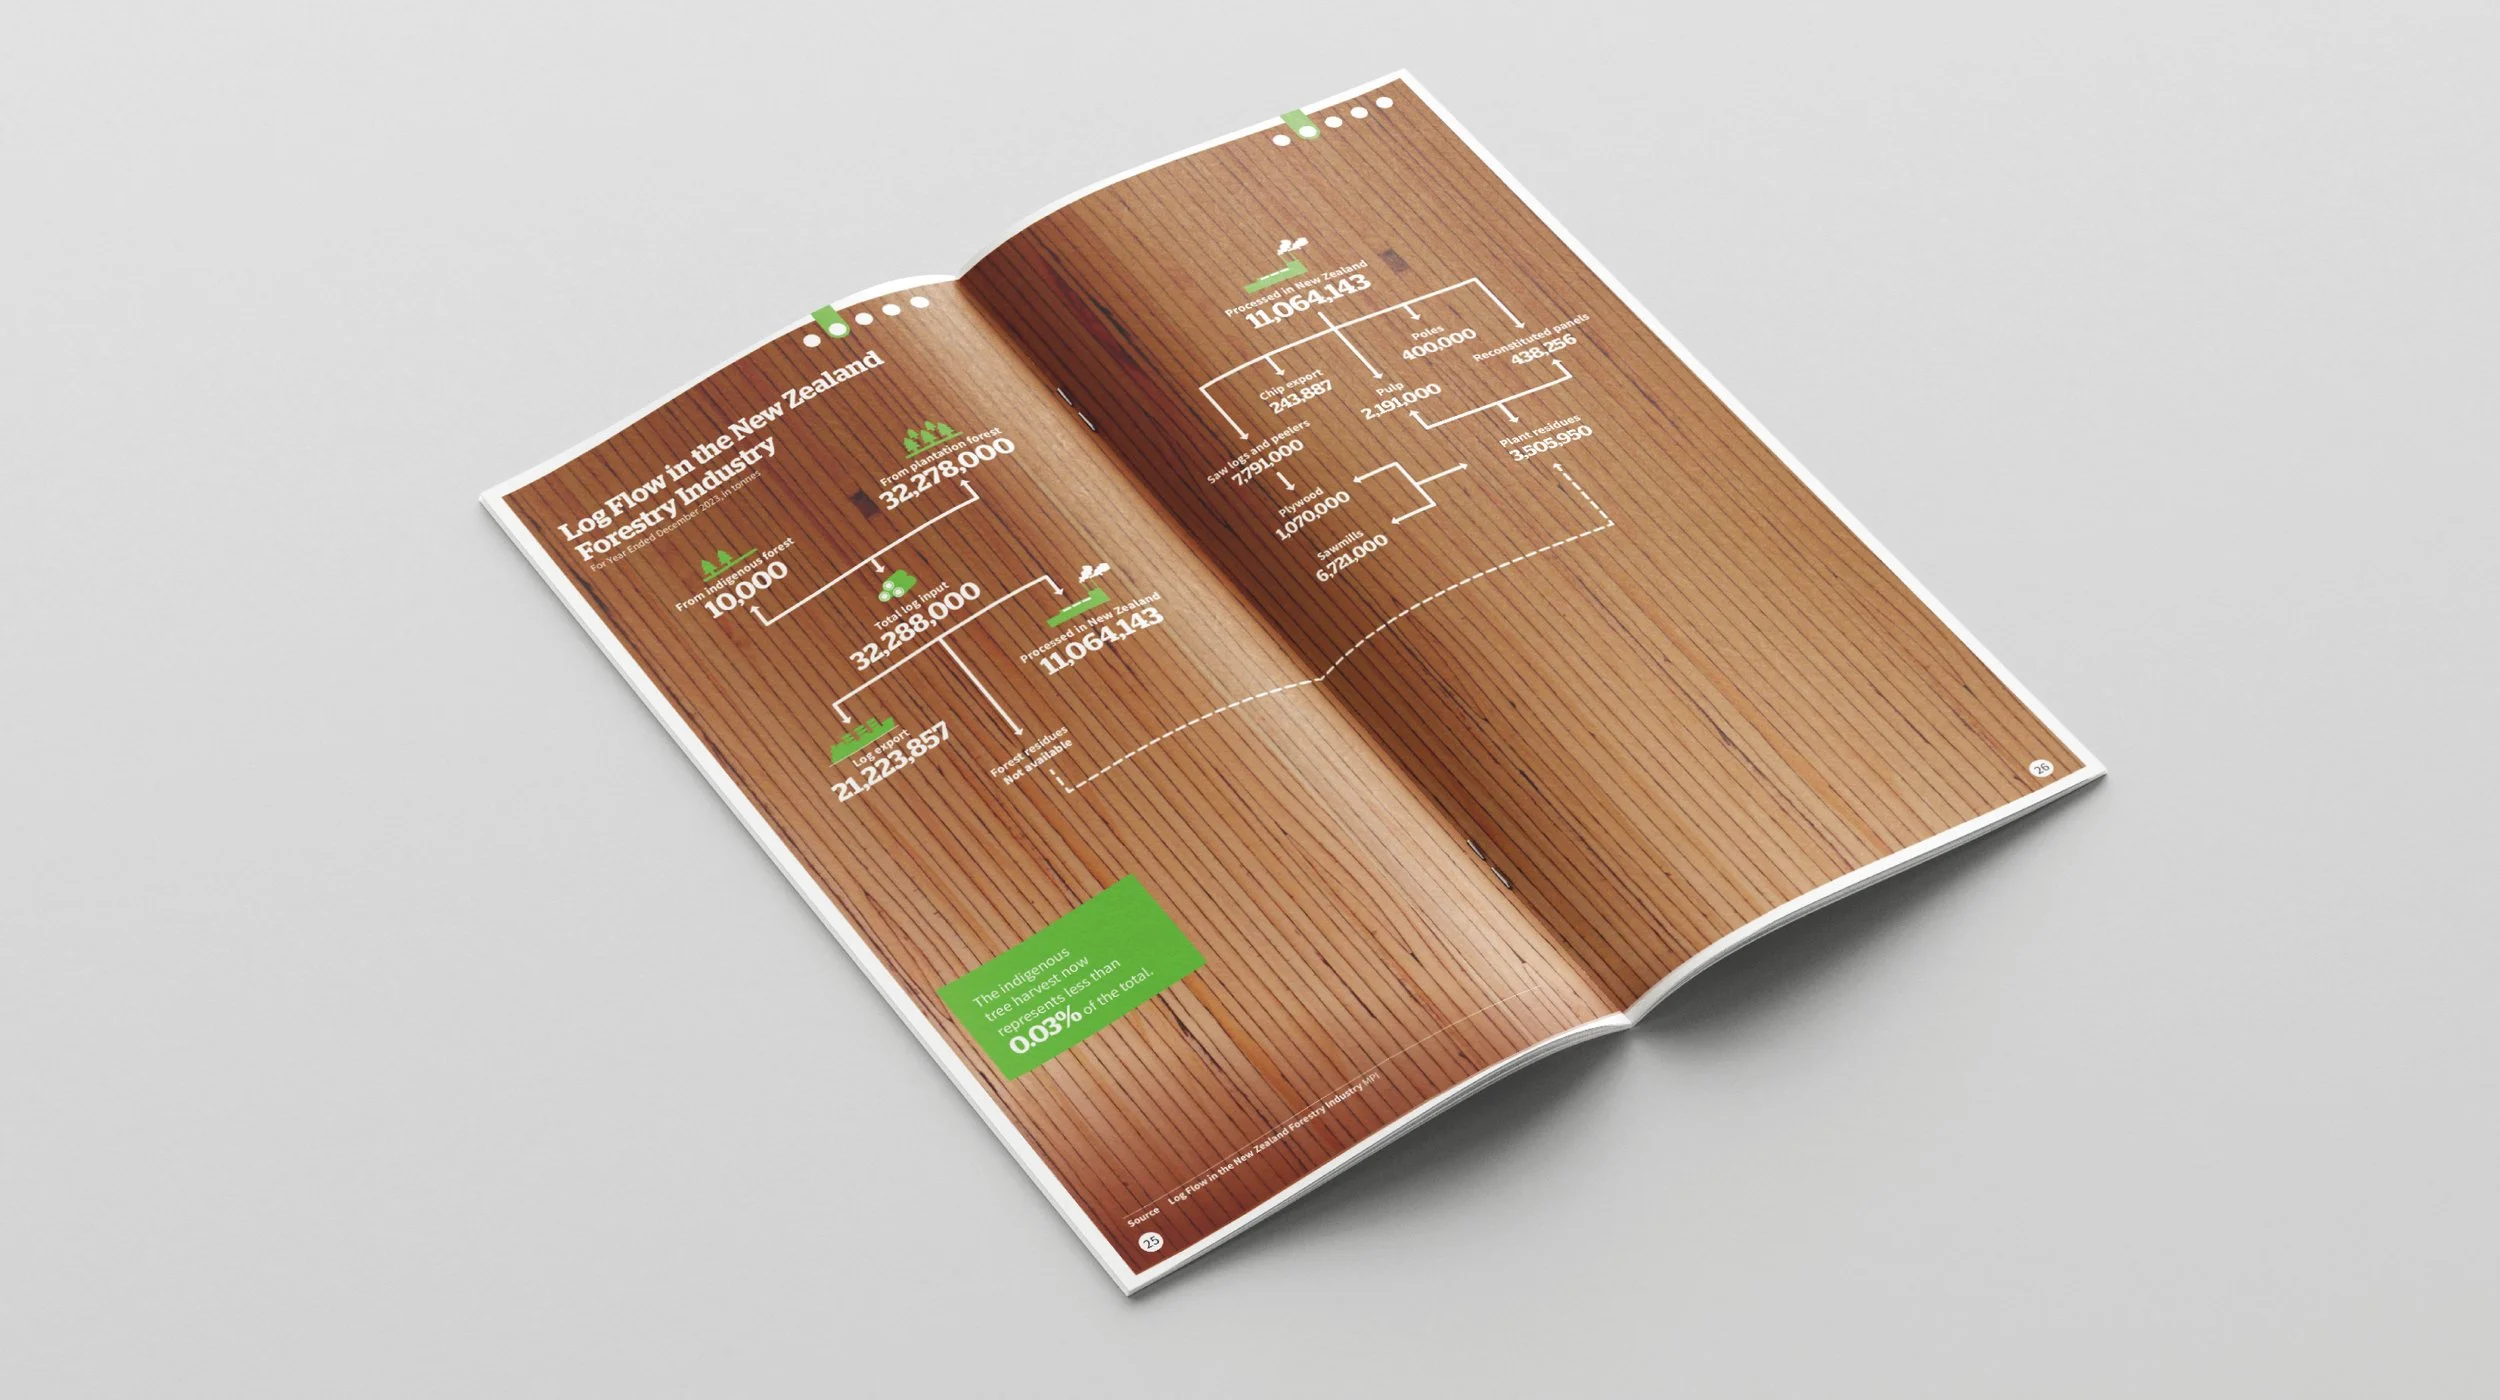
Forest Owners Association

Data templates
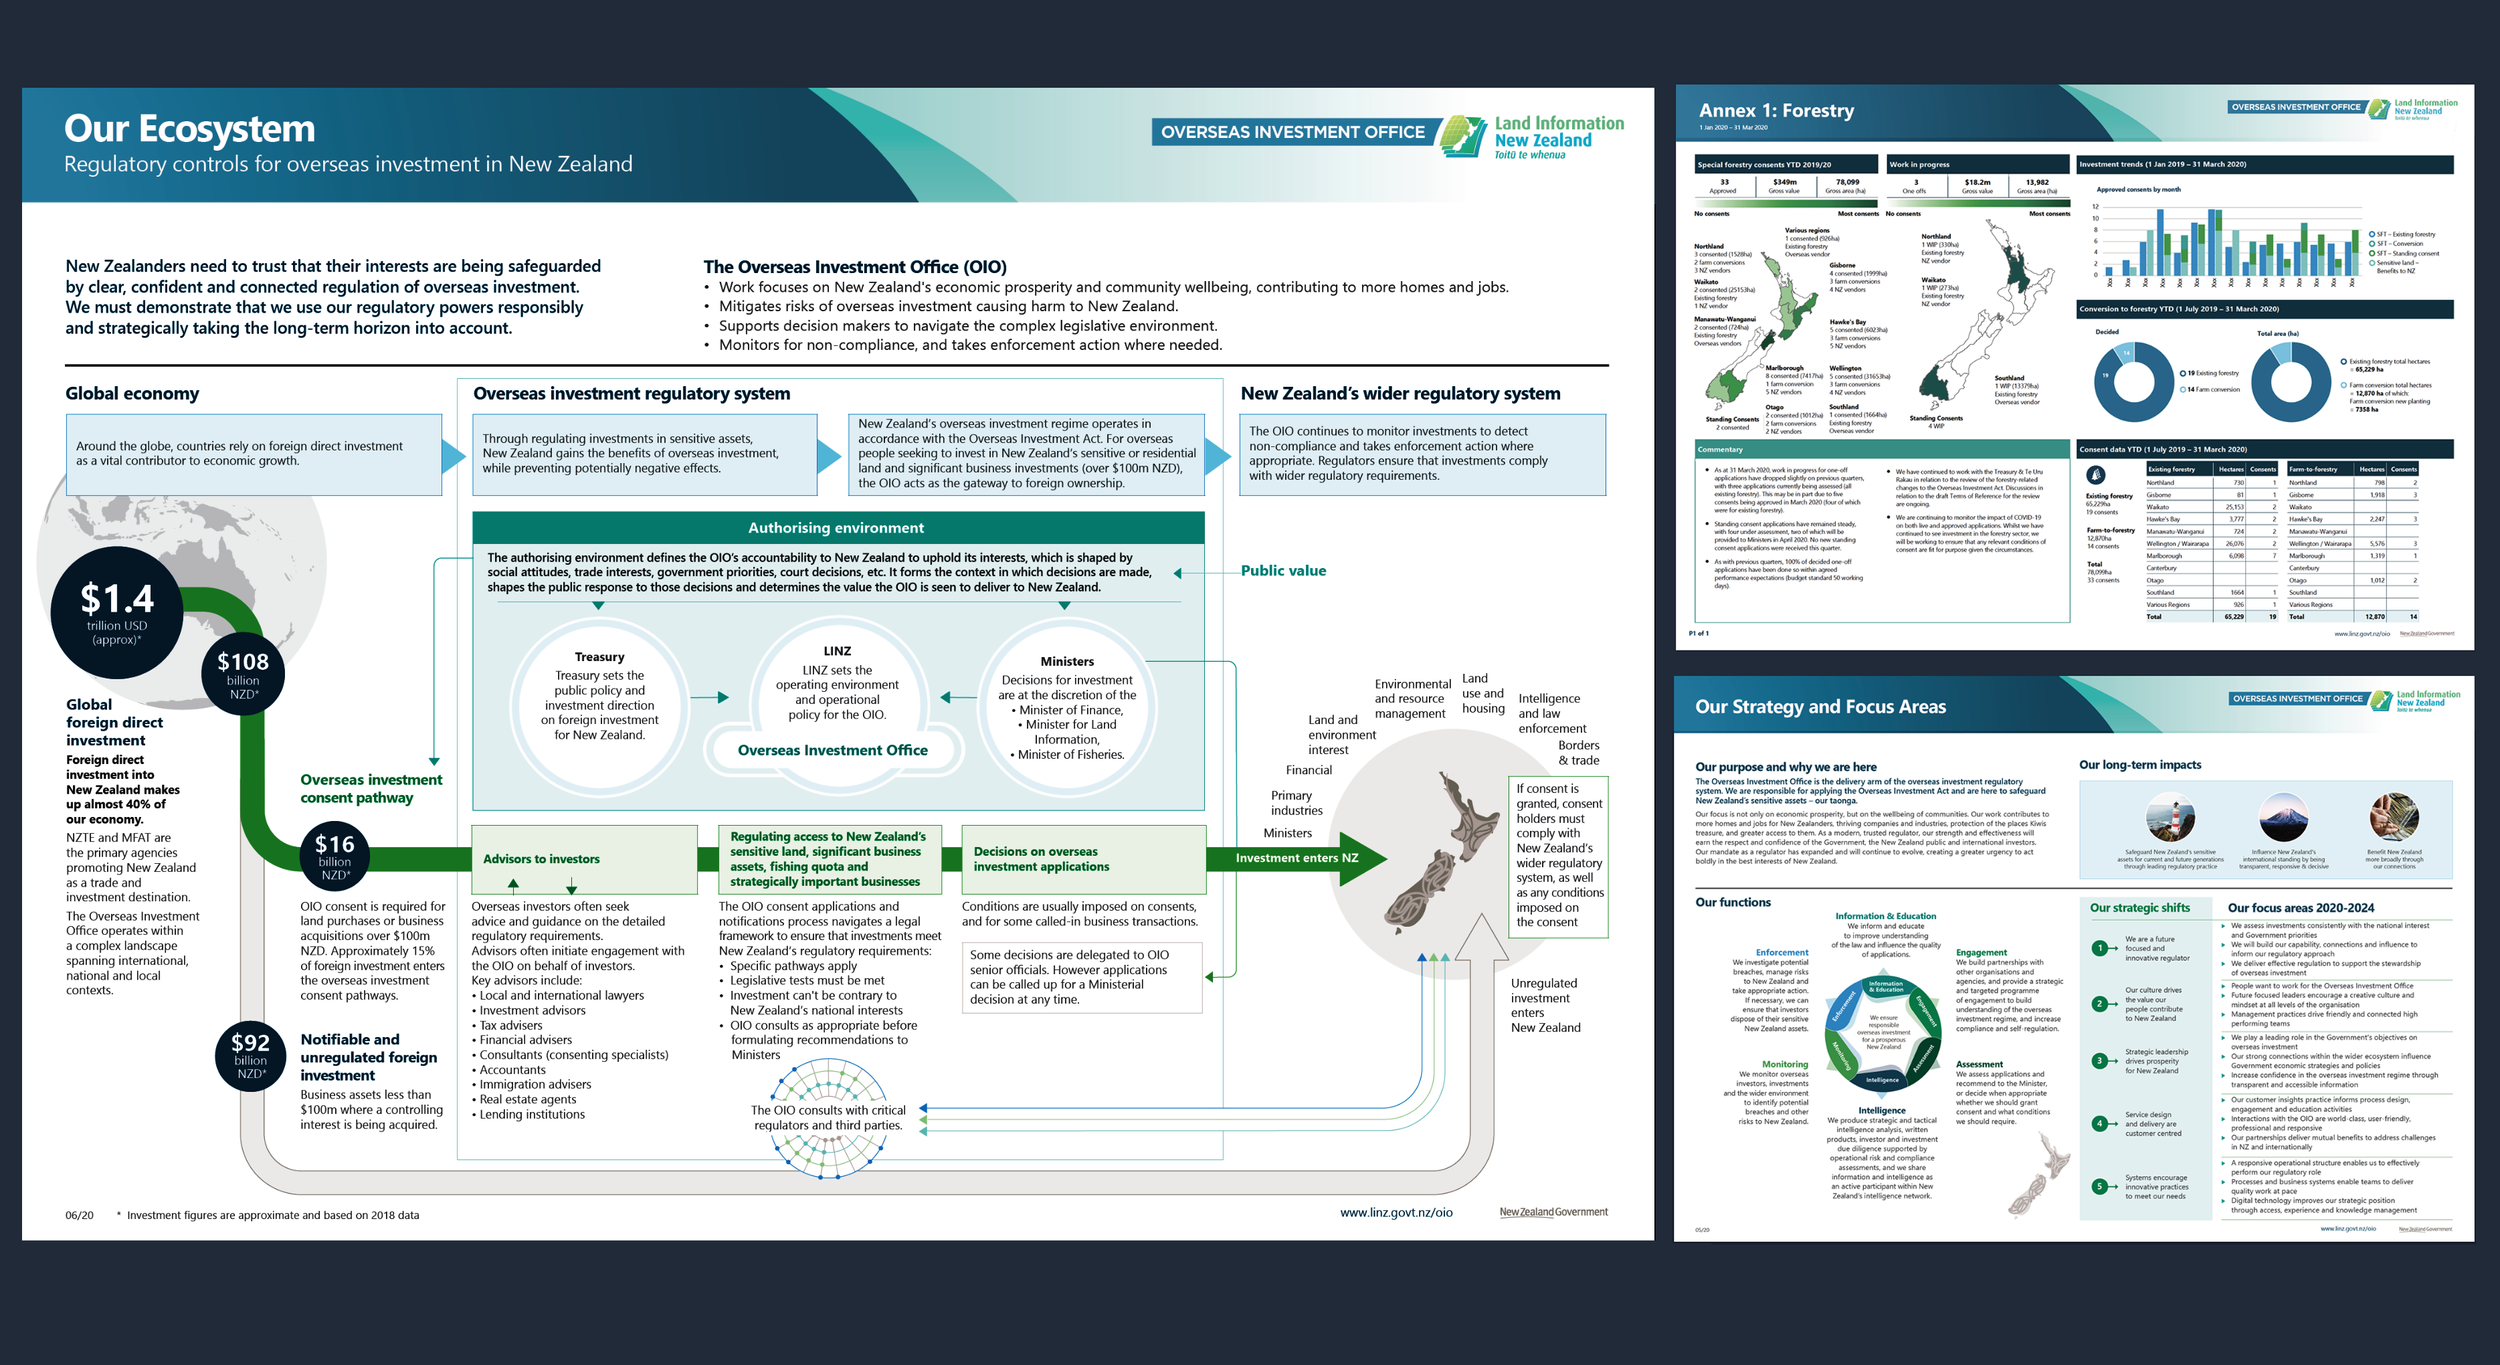
Toitū Te Whenua Land Information New Zealand
Transport infographics
Ministry of Transport Te Manatū Waka


Layouts based on statistics
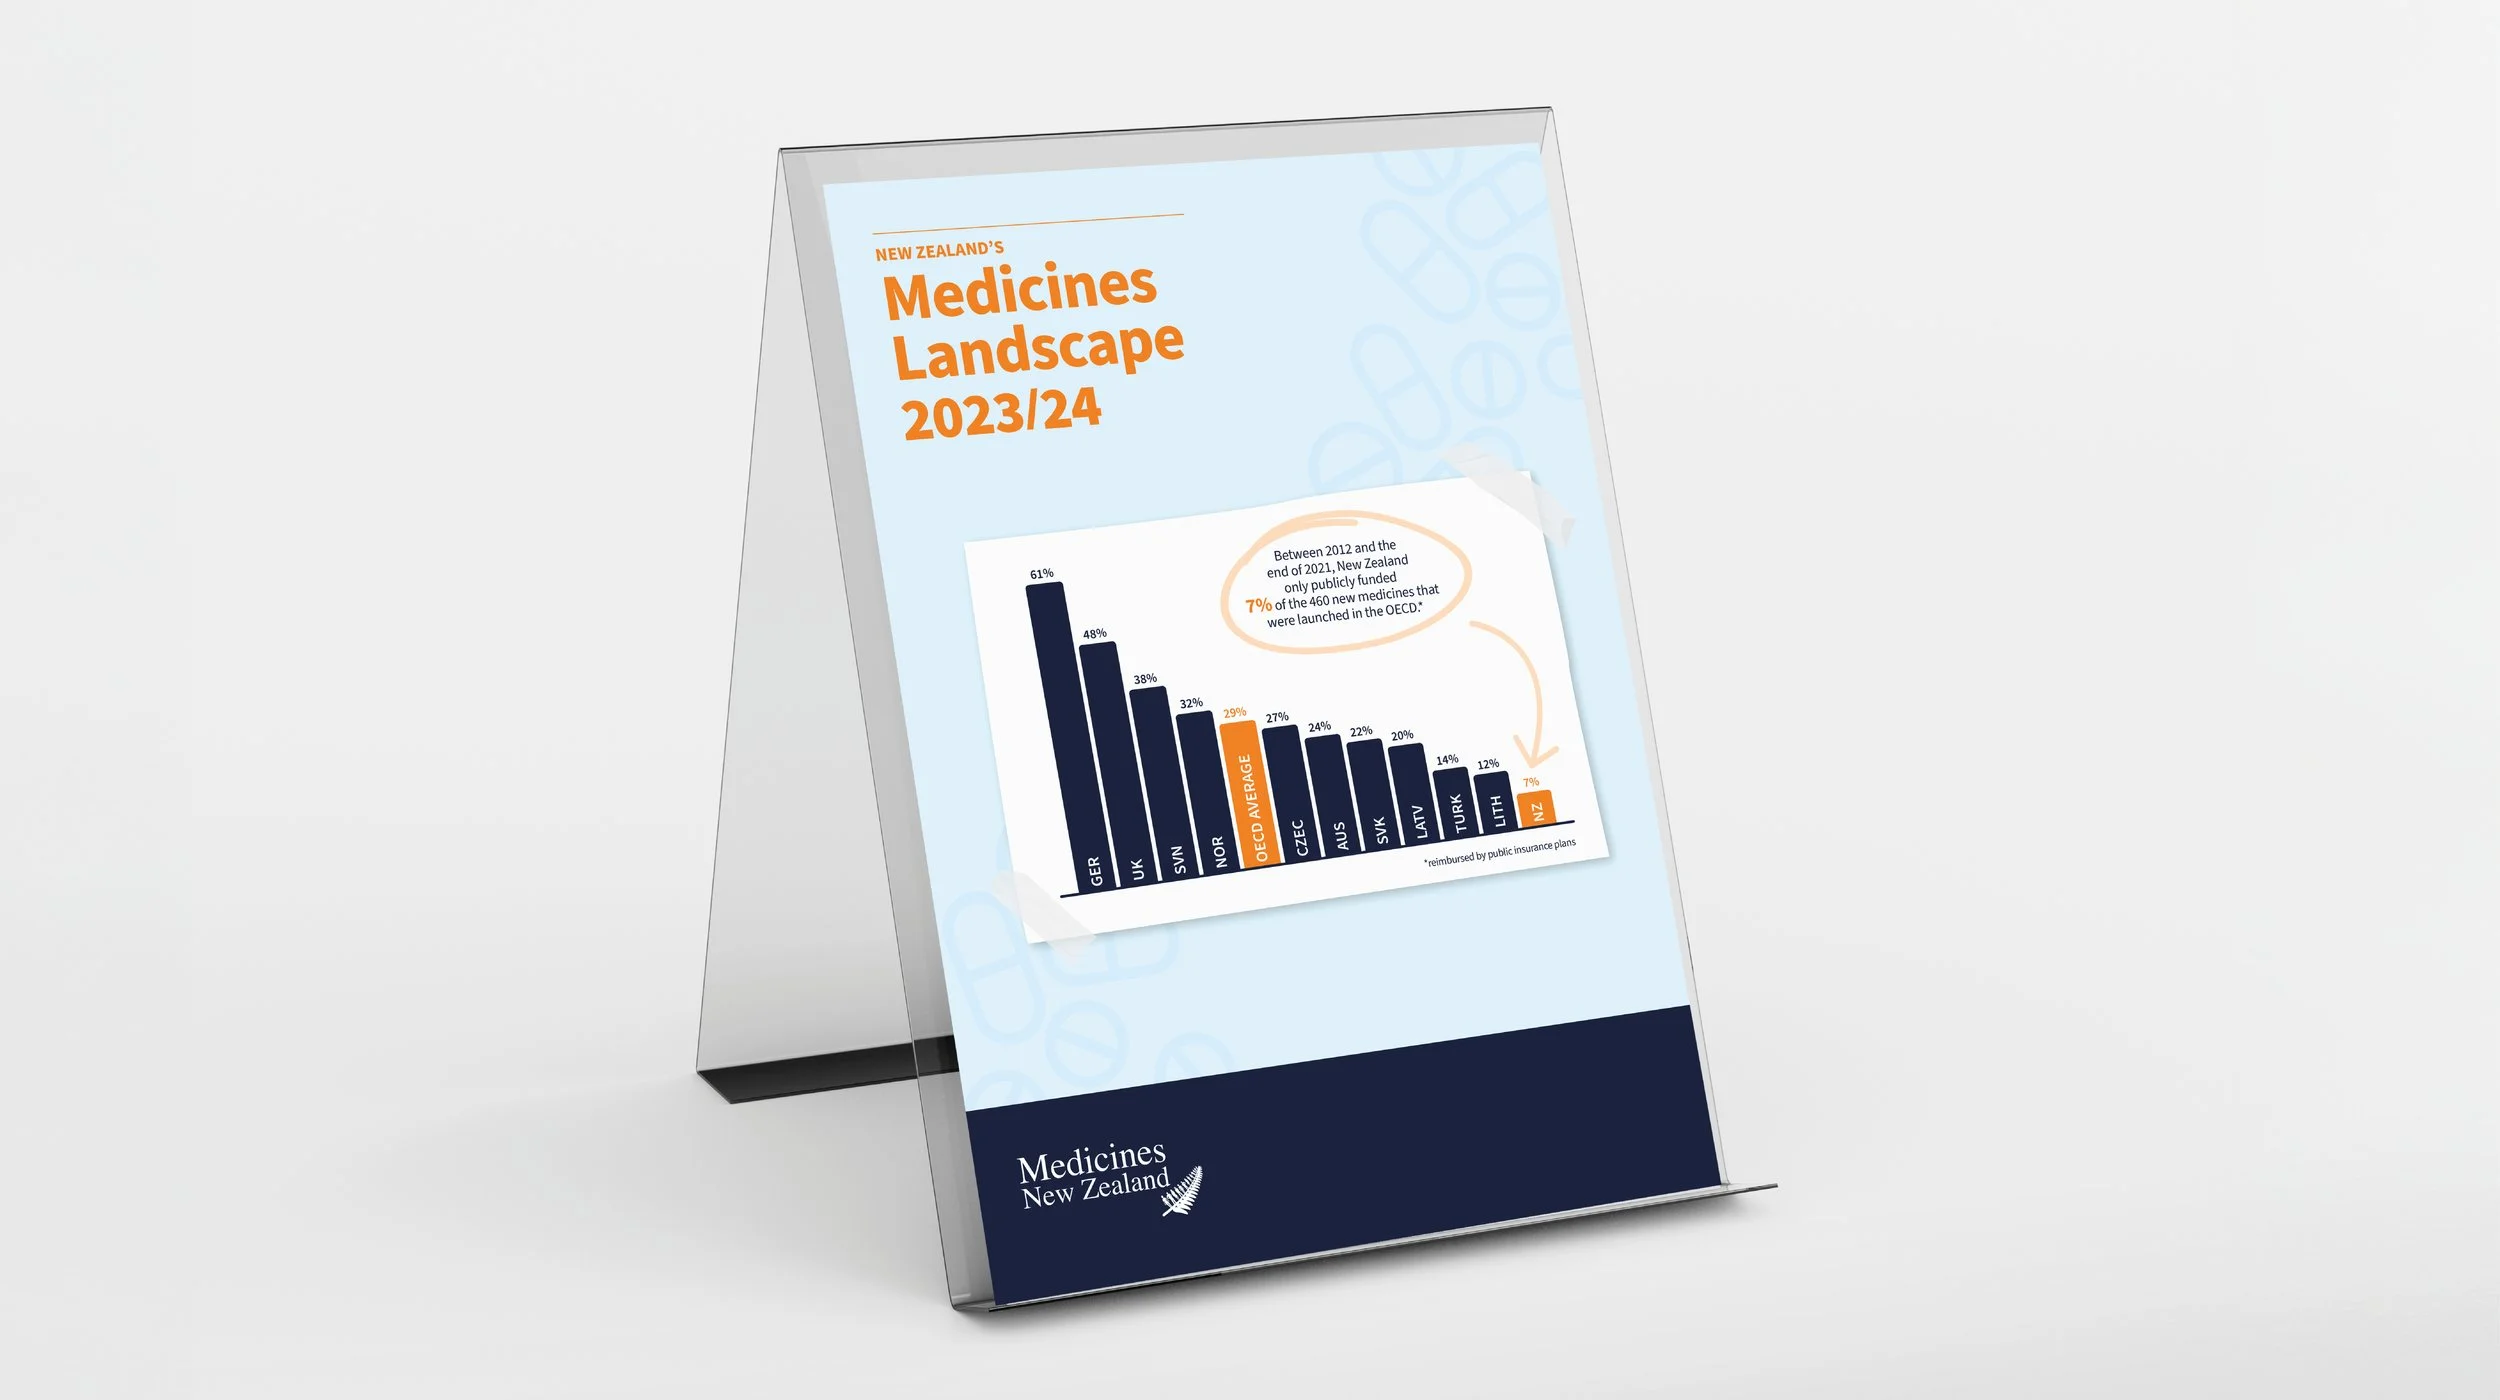
Medicines New Zealand
